
Paragon Automation - Device LCM
Overview
Paragon Automation is a Network automation platform and simplifies adoption of Network automation for device , network and service life cycles . The idea of Paragon is to eliminate repetitive tasks , improve operation efficiency.
This is a hands-on lab for Paragon Automation use cases Device LCM and Observability, L3VPN Orchestration, PAA, complex config templates .
This lab is based on Paragon Automation 2.0 features and the objective is to get hands on experience on these use cases . The platform will be preinstalled and preconfigured to start with specific use cases. We will be using vMX devices along with PA2.0
Starting Lab
This lab allows for 16ppl (4ppl per sandbox) to take this lab persession.
If you would like to do this lab raise your hand to get Lab User information.
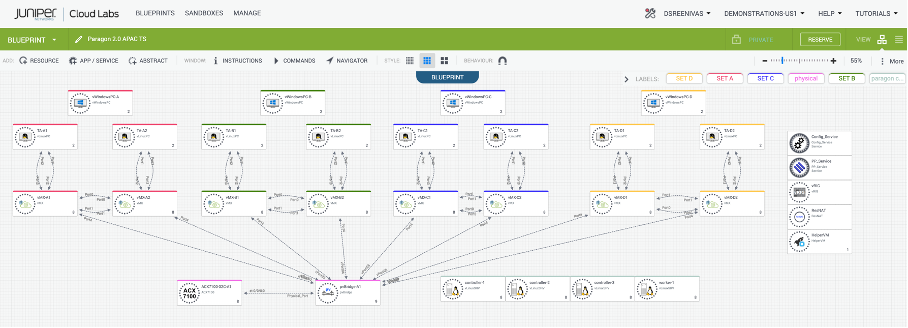
Lab Blueprint Topology
The blueprint consists of four sets of vMX devices with traffic agents (TA’s), SET A, B, C and D. Also, a standalone shared ACX7100. Please note that you must choose the right SET of devices allocated to you.
We also have a Paragon Automation 2.0 on-prem instance installed with all device sets on-boarded.
Connect to Jumpbox
Using RDP Client, connect to your Labuser assigned IP address/Port
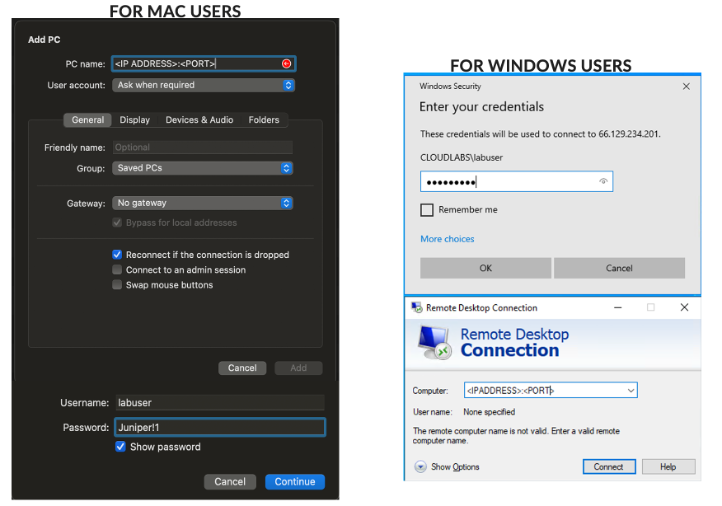
Login using your Lab User credentials
Device Lifecycle Management
The objective is to demonstrate Device lifecycle management, Observability and Trust use cases
Login to Paragon Automation GUI
Take a configuration Backup
Deploy a simple configuration template
Review Audit Logs
Review the last config change by way of diff and check if this caused any issues.
Review Trust score
Review Interfaces Health
Review outstanding Alarms, Alerts and syslogs
Login to Paragon
Open Chrome, and navigate to https://100.123.42.100, you shoud see the login page to Paragon Automation UI
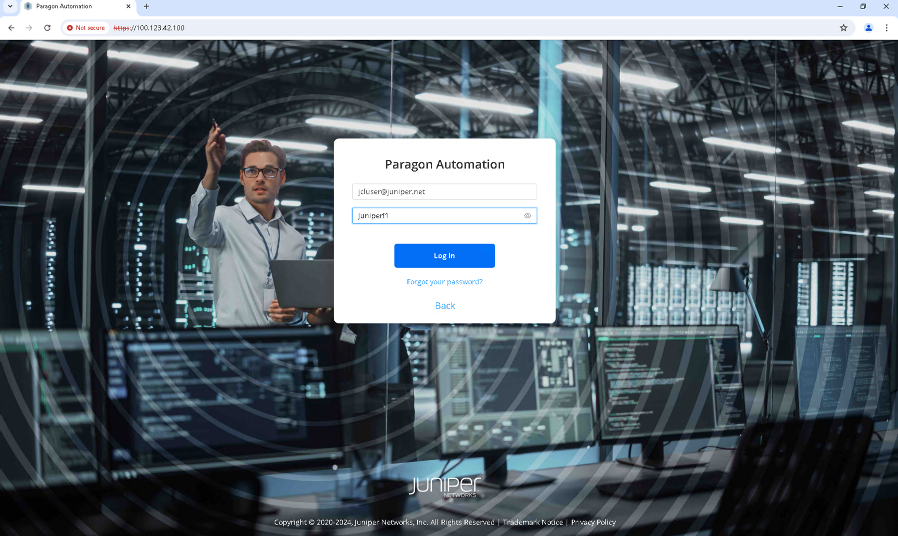
Login using your Lab User credentials
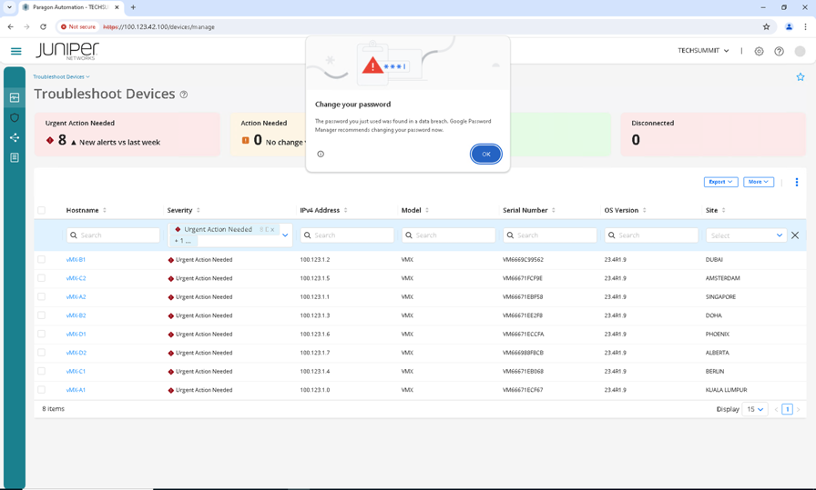
Take Configuration Backup
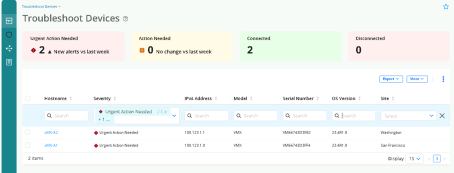
In the Paragon UI on the left side pane, go to Observability > Troubleshoot Devices.
Under Hostname click on Lab User - Device 1, you will then see the Accordion View.
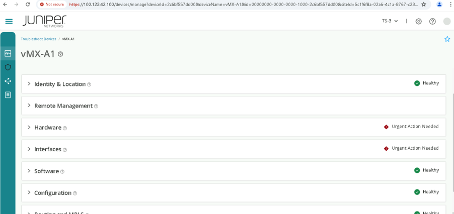
Click Configuration > Backup > OK
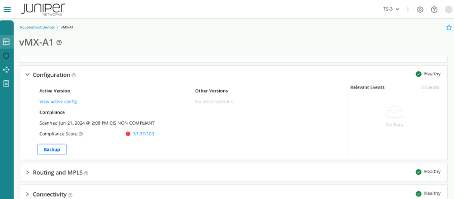
You should see the backup is completed successfully and the latest version of backup is shown with timestamp as below.
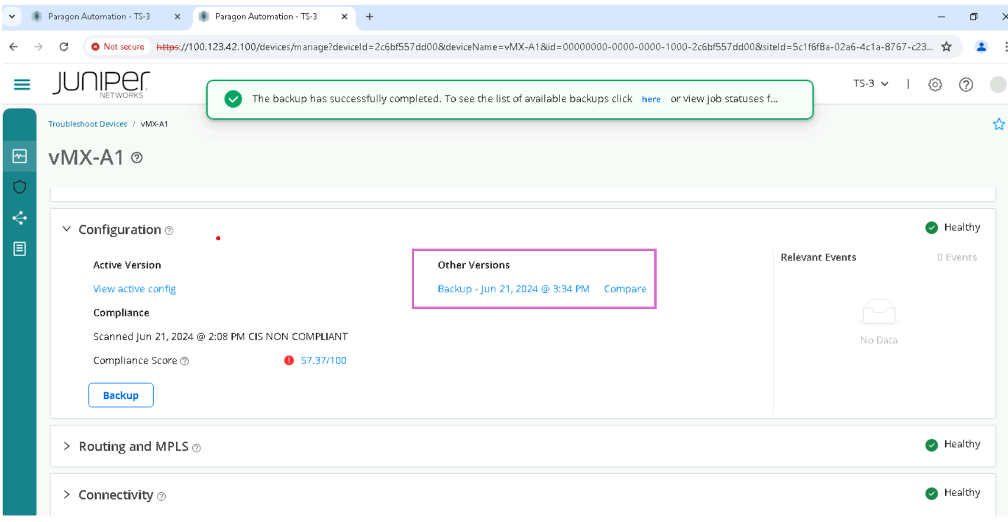
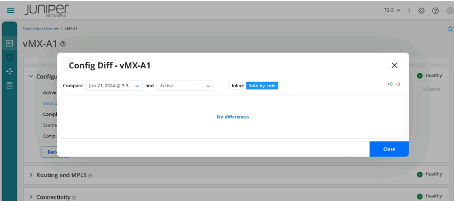
Click Compare, make sure you compare the latest version of backup and Active. you will see no difference.
Deploy A Simple Configuration Template
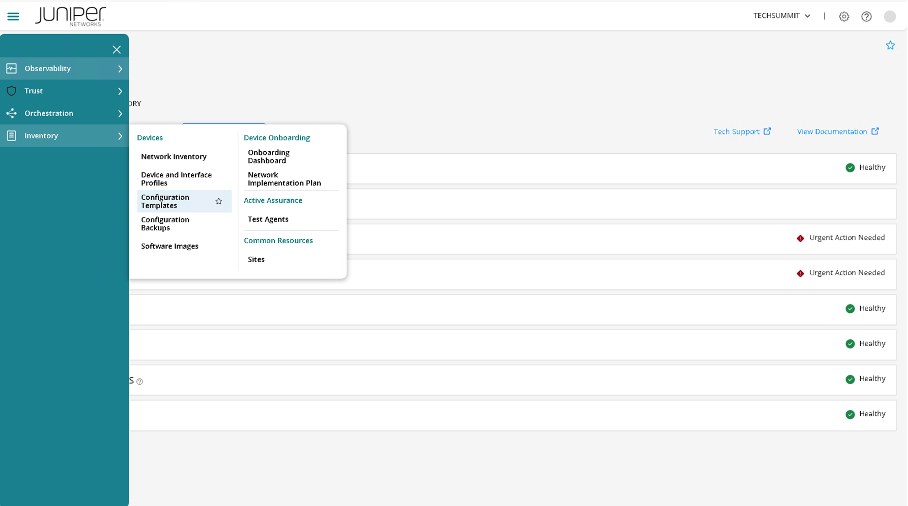
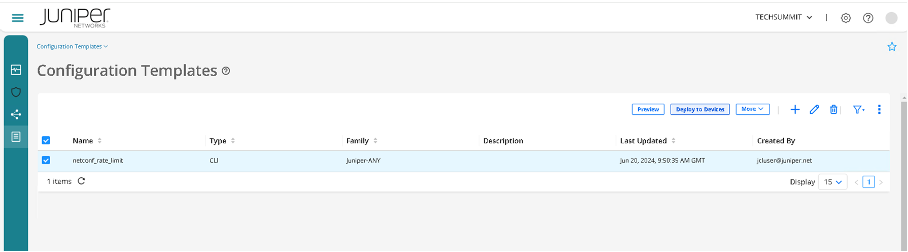
Click Inventory > Configuration Templates, and select netconf_rate_limit.
Click Deploy to devices
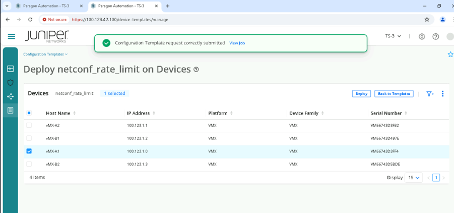
Select Lab User - Device 1, and click Deploy
Note: Please do not use other device as this may conflict with other participants.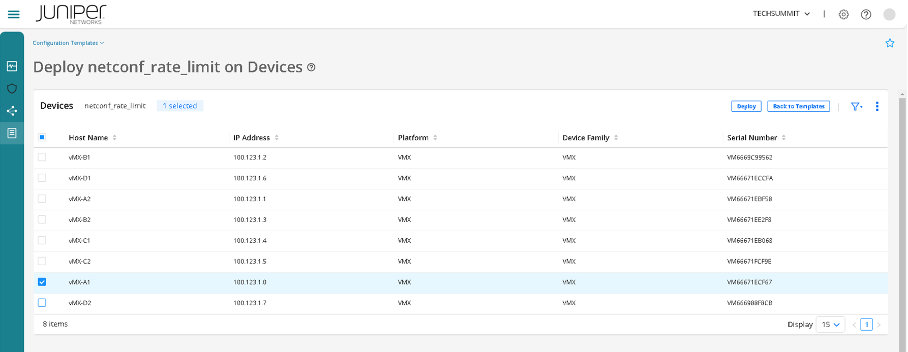
You will see a page with Set Configuration Parameters, do not change anything (let it be default).
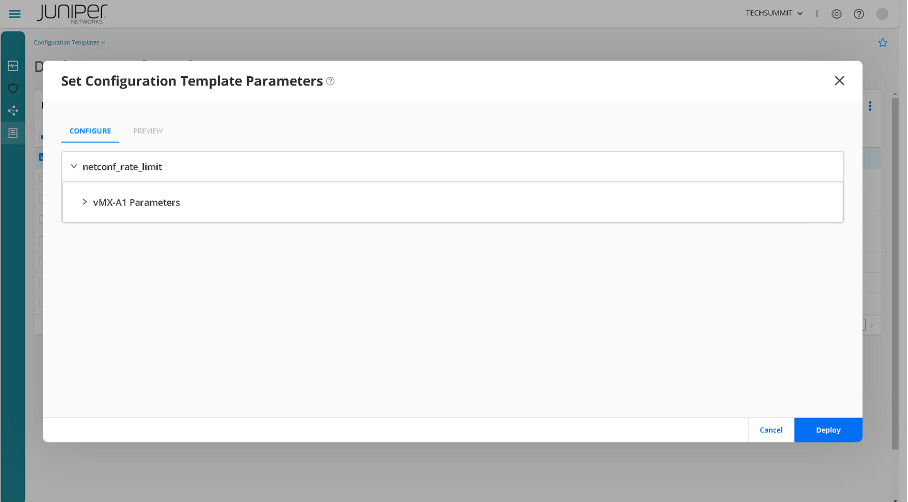
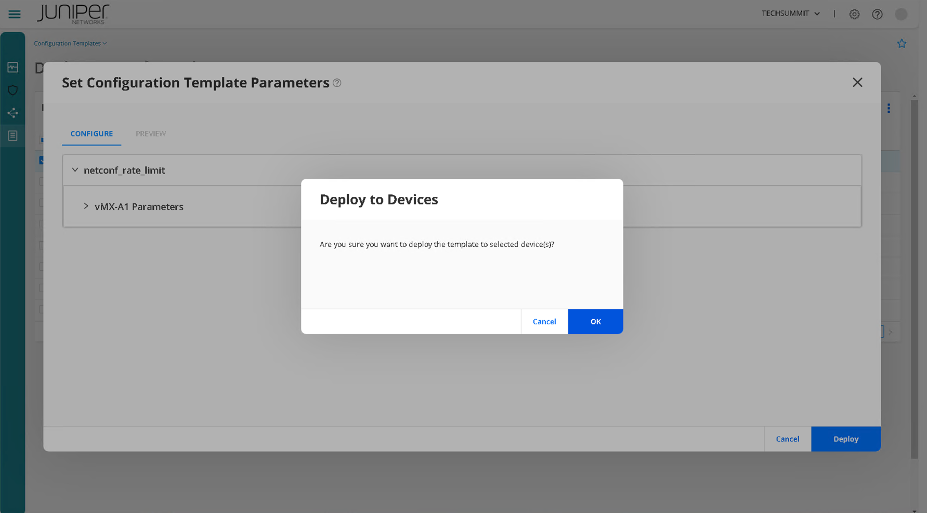
Click on OK for the question Are you sure you want to deploy the template to selected device(s).
You should now see the Configuration Template request correctly submitted.
Review Audit Logs
Navigate to Settings > Audit Logs
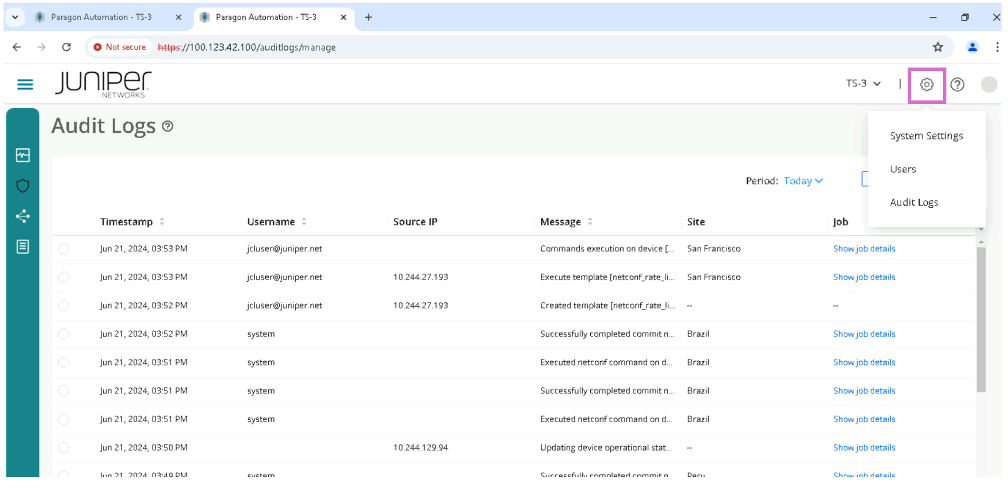
Select a job (any job) and click More > Detail.
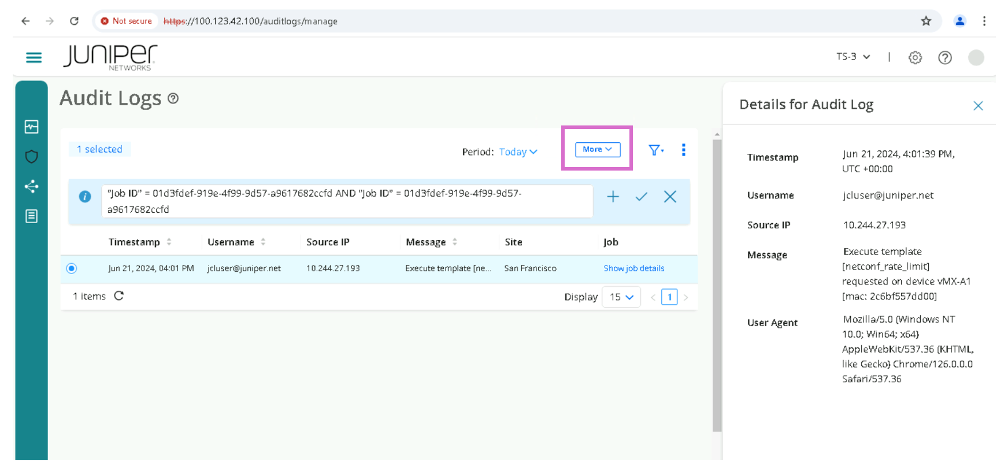
Review the Audit log message.
Review Configuration Difference
Click on Observability > Troubleshoot Devices.
Select Lab User - Device 1.
Click Configuration > Compare
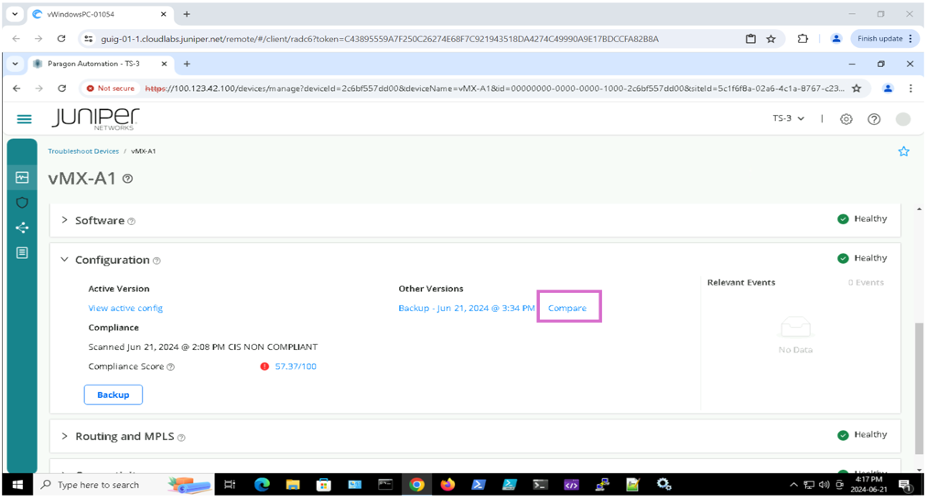
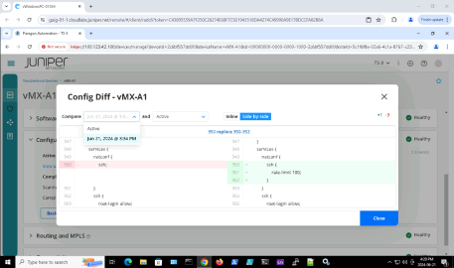
Make sure to select latest backup and Active to Compare . Review lines added in Green and Lines deleted in Red highlight.
Review Trust Score
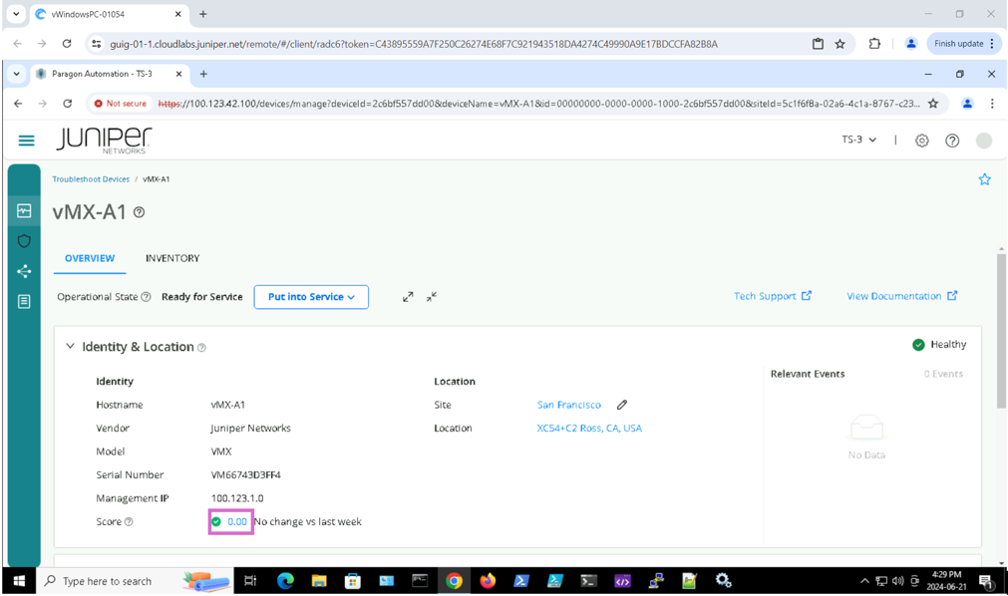
Click on Observability > Troubleshoot Devices.
Select Lab User - Device 1.
Click Identity & Location > Score, this is the Trust Score.
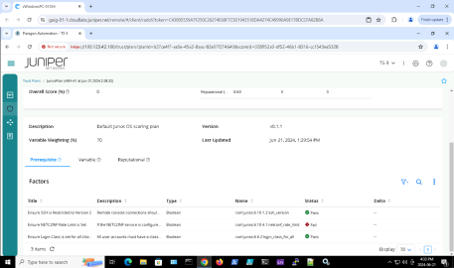
You will see a list of snapshots. Please click on the first one.
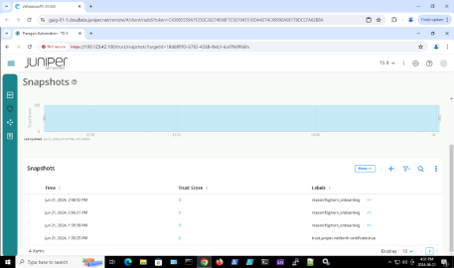
Review Trust Score weights.
Review Interface Health
Click on Observability > Troubleshoot Devices.
Select Lab User - Device 1.
Click Interfaces, and review if the interfaces are flapping or if any input or output interfaces are unhealthy.
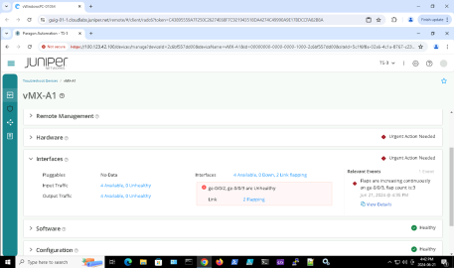
Click on Output Traffic and review if there are any FEC or CRC errors.
Note: Note that you can change the time range (default is set to 30 minutes)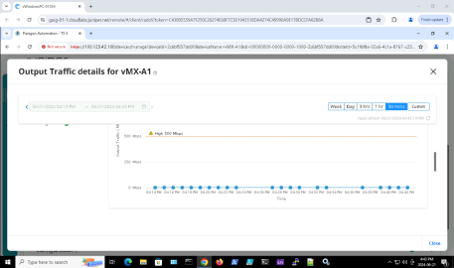
Review Alarms, Alerts, and Syslogs
Click on Observability > Events, and review Alarms, Alerts, and syslog.