
OpenJTS
Pick-up OpenJTS VM
Depending on your student number, pick up the corresponding OpenJTS VM X, where X is the Student Number.
Connect to the OpenJTS VM with SSH and follow the next steps.
Download and install OpenJTS stack
Downloading and installing the OpenJTS stack is straightforward. Few commands are needed if you keep default parameters, such as using default ports and clear-text gPRC/gNMI sessions. First, from your OpenJTS VM, once connected to the Linux VM (labuser/Juniper!1) create a dedicated JTS directory under /opt:
sudo su
>> fill in the password: Juniper!1

mkdir /opt/JTS

cd /opt/JTS
Then, download/clone the OpenJTS repository – Do not forget the trailing “dot”.
git clone https://github.com/door7302/openjts.git .
Build OpenJTS and start the stack
The first time you launch the OpenJTS stack, each container will be fetched either from DockerHub or GitHub and will be compiled. This could take a few minutes. Be patient. As mentioned, only the first time will request more time to boot up the stack - further start will take only few seconds.
From your OpenJTS VM, move first in ./compose directory, and launch the stack:
cd /opt/JTS/compose

docker compose up -d
At the end of the compilation process, you should see all the containers up and running:
 ✔ Network compose_default  Created                                                                                                                      0.2s
 ✔ Container jtso           Started                                                                                                                      0.6s
 ✔ Container influxdb       Started                                                                                                                      0.5s
 ✔ Container kapacitor      Started                                                                                                                      1.6s
 ✔ Container grafana        Started                                                                                                                      1.6s
 ✔ Container telegraf_vmx   Started                                                                                                                      1.3s
 ✔ Container telegraf_ptx   Started                                                                                                                      1.7s
 ✔ Container telegraf_acx   Started                                                                                                                      1.1s
 ✔ Container telegraf_mx    Started
Initial MX configuration
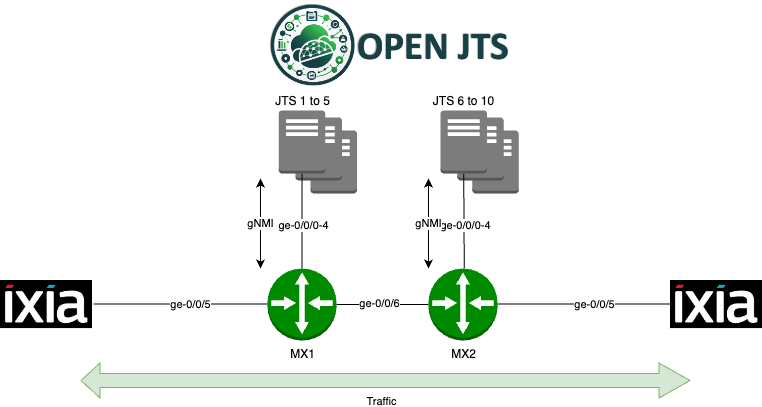
Depending on your student Number X (refer to Table 1), connect to the MX attached to your OpenJTS VM and apply this initial configuration:
Add a jts user (pwd: grpc123)
Enable netconf server
Enable gRPC server (clear text) that listens to tcp port 9339
Either on MX-1 or MX-2, depending on your student Number:
edit private

set system login user jts class read-only
set system login user jts authentication encrypted-password "$6$R51AUuu/$N5UP3yv.HYt3/rhLh1JXvpXNRQaMxtr1dvZyZCNJgf/i5dtzDVWrEAnt87ZStajIXmrai9VeWjgYMmDD1DJVf0"
set system services netconf ssh
set system services extension-service request-response grpc clear-text port 9339
set system services extension-service request-response grpc max-connections 30

commit and-quit
Initial OpenJTS configuration
Once your OpenJTS stack is up and running, you can access its Web UI. From the JCL lab’s sandbox, click on the “More Options” arrow and select HTTP to open the main OpenJTS Web page.
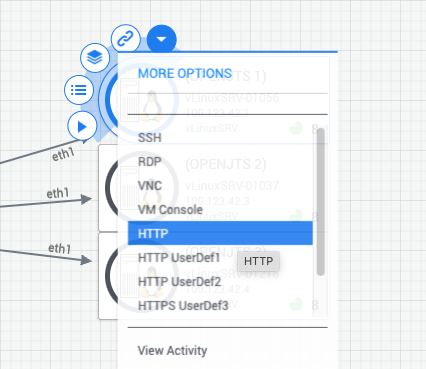
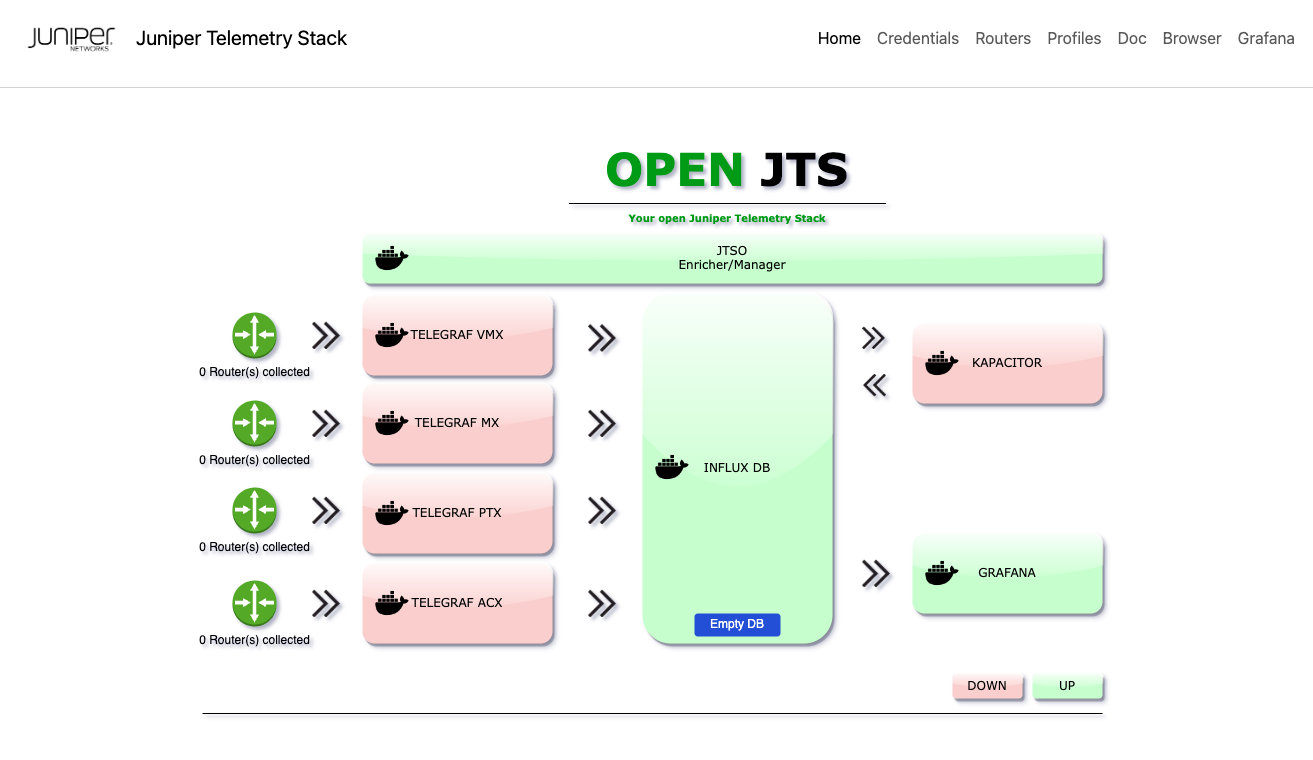
You should see the following web page, which gives you each container’s status. Unsed containers are automatically shutdown by the JTSO (JTS Orchestrator).
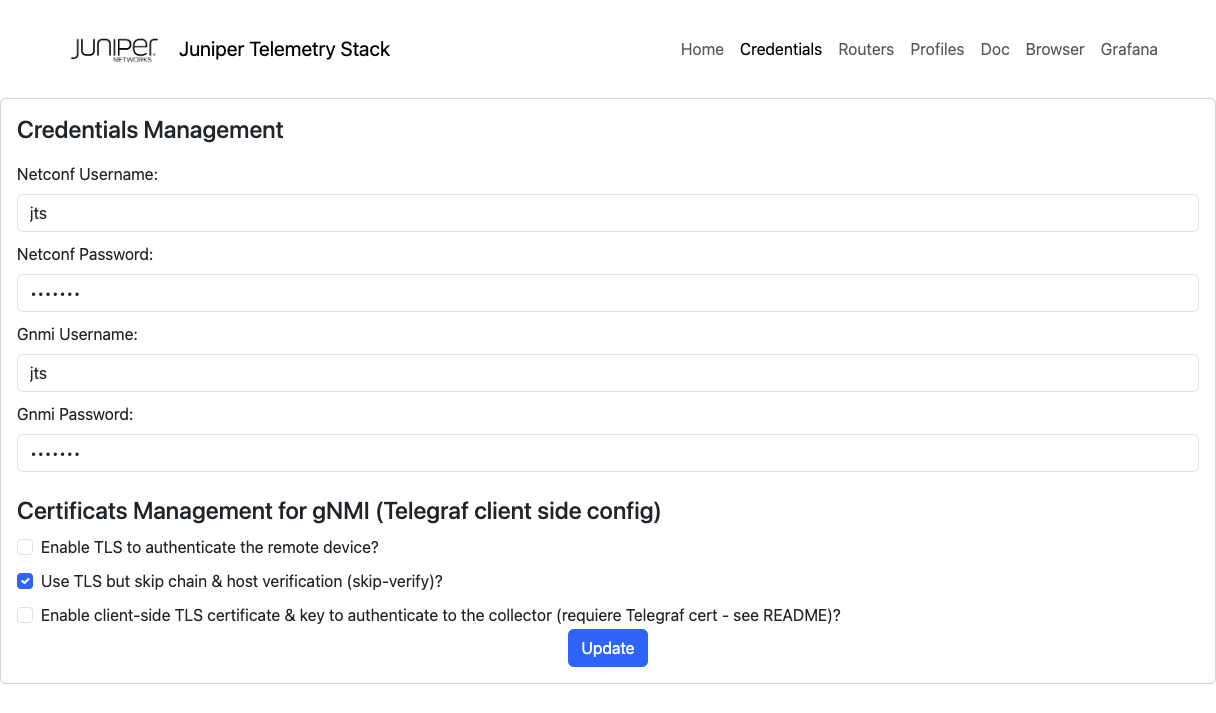
Fill in the credentials
Go on to the “Credentials” page, and for both Netconf and gRPC credentials fill in the Username=jts and the Paswword=grpc123. Then apply the changes (button “Update”)
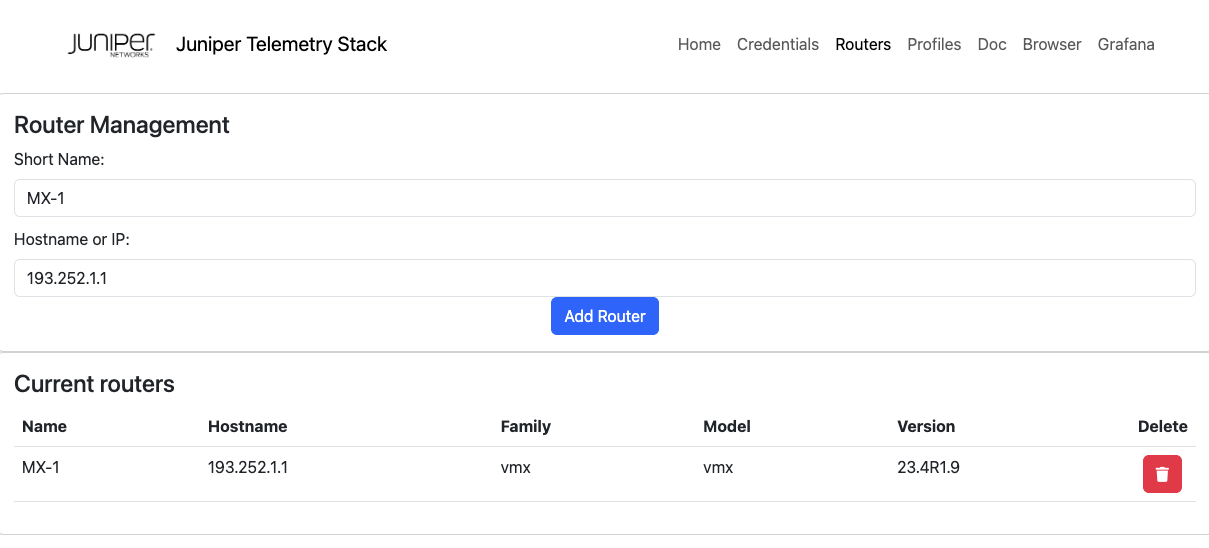
Add your MX router in your inventory
Go on to the “Routers” page, and depending on which MX router is connected to your OpenJTS VM, add a short name + the IP address of your MX.
Student Number X |
MX Name |
MX loopback |
|---|---|---|
1 to 5 |
MX-1 |
193.252.1.1 |
6 to 10 |
MX-2 |
193.252.1.2 |
Once the “Add router” button is pressed, automatically, a Netconf session will be established between OpenJTS and the remote router, and some facts, such as the router’s model, version, and family, will be gathered.
Test gNMI connectivity
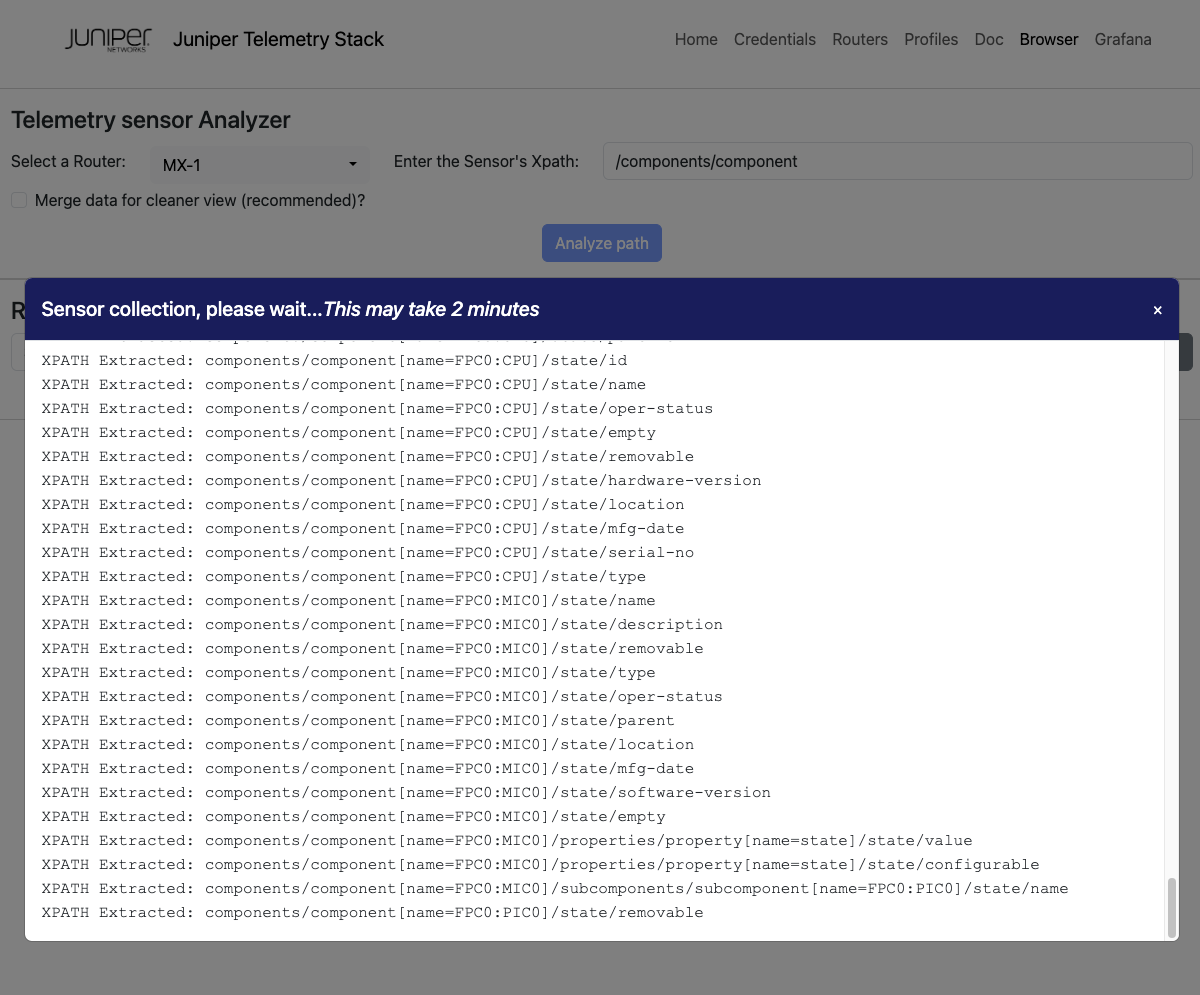
The simplest way to test the gNMI connectivity between your OpenJTS VM and your router is to use the embedded “Browser” tool. This tool is usually used to troubleshoot a sensor path or build a new JTS profile.
Let’s try, go on to the “Browser” page, select you MX in the list and try to browse the well-known OpenConfig “platform” sensor path starting from: /components/component Unselect the “Merge…” option to have the full sensor path view.
The data collection takes around 1 to 2 minutes. You can follow the paths extracted in real-time.
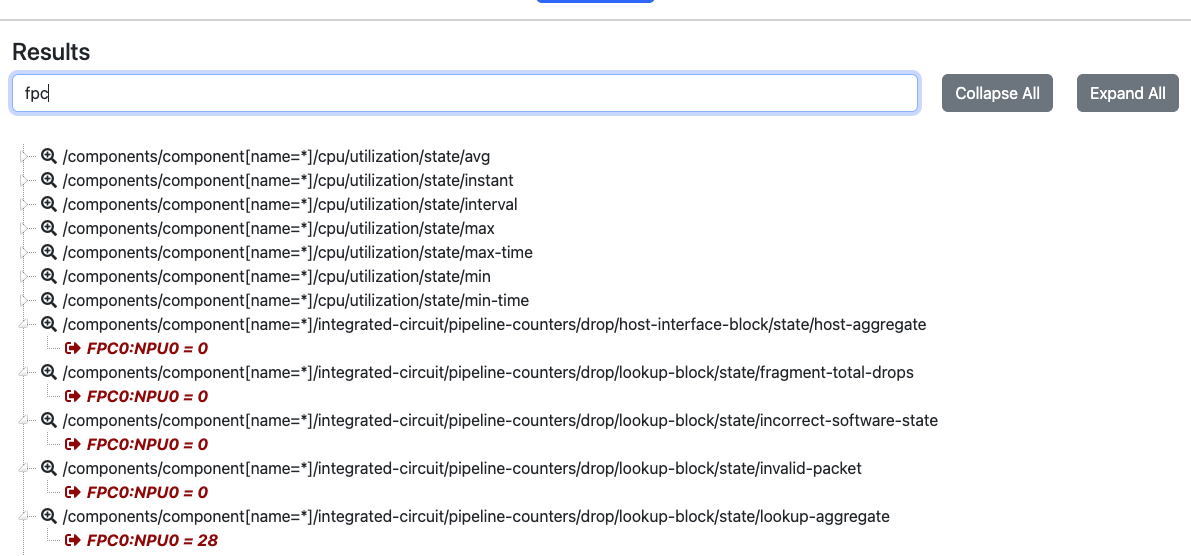
Once the data collection is finished, you can navigate into the results via a Tree View representation. You can also search for a given “string,” such as “fpc,” in the example below. All the Keys and Values matching the string will be highlighted.
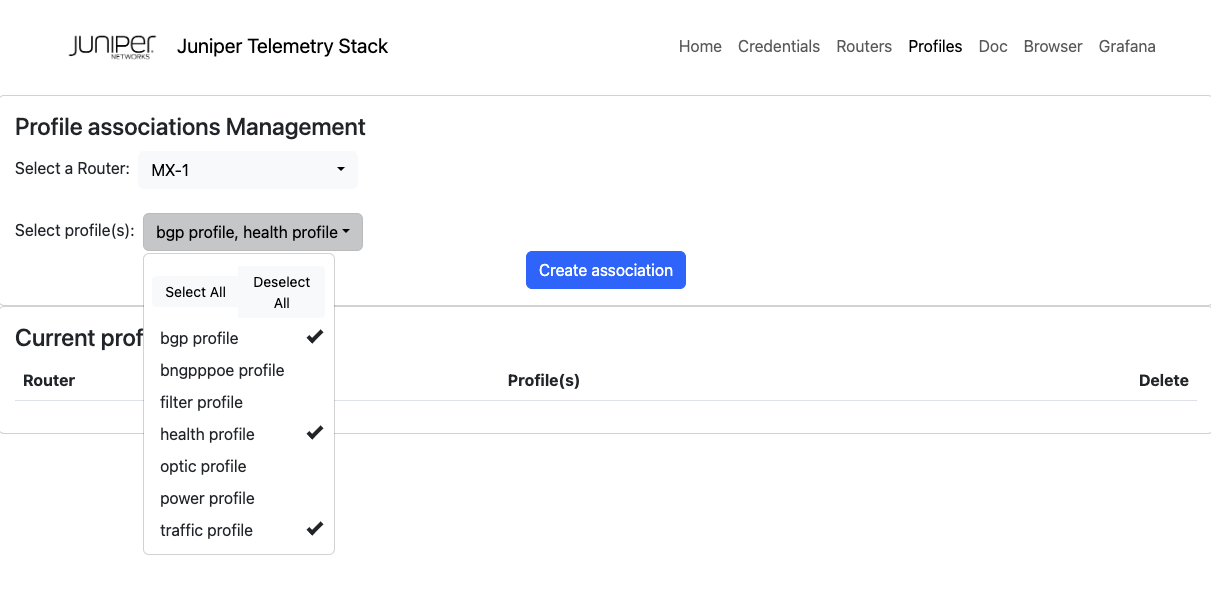
Profile(s) assignement
It’s time to start collecting some Telemetry sensors. Go to the “Profiles” page and select your MX router in the list. Then, select three profiles: BGP, Traffic, and Health profiles. Finally, press the “Create Association” button.
The OpenJTS stack is automatically fully reconfigured, data collection starts, and KPIs are saved in the database.
You can switch to the “Home” page to see if the “VMX Telegraf” container has been started.
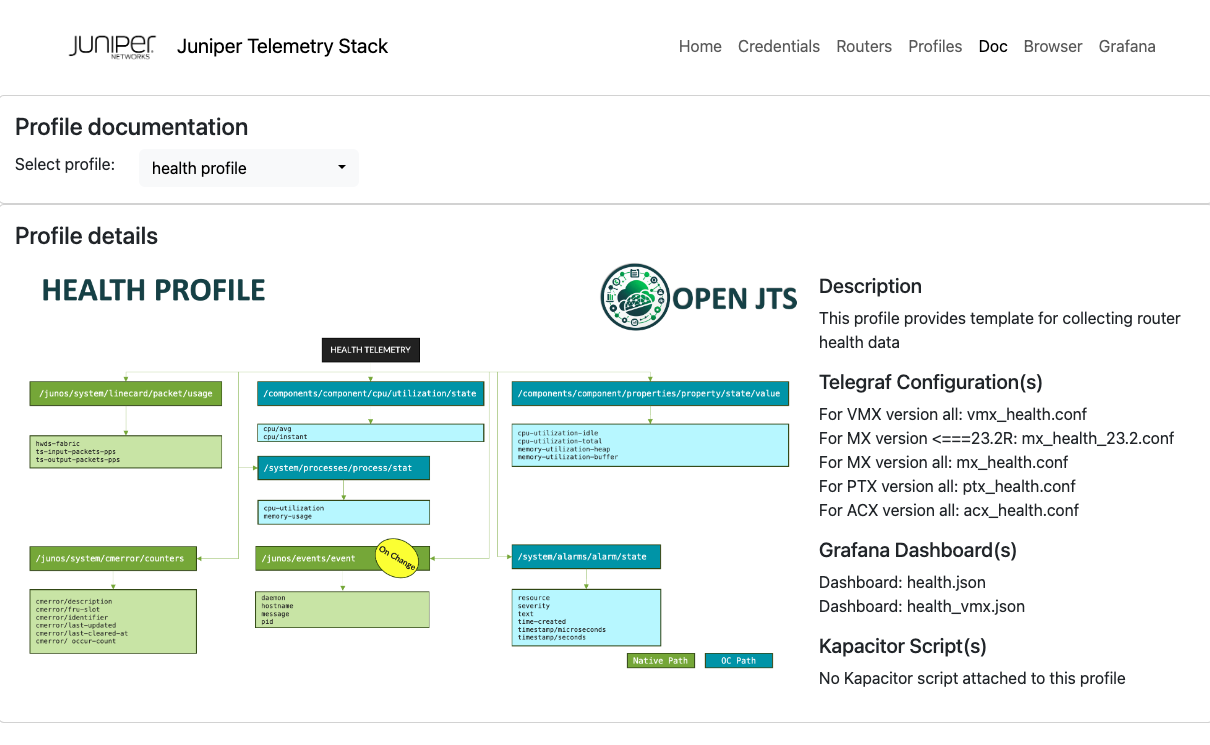
Profile(s) Documentation
Before visualizing data using pre-included Dashboards, let’s examine the Documentation menu. Go to the “Doc” page and select one profile in the list. For instance, select the Health profile. This menu helps you determine which sensor paths have been subscribed and which specific counters. A color indicates the type of DataModel: Native vs. OpenConfig.
Visualize data
It’s time to switch to Grafana. From JCL lab’s sandbox, click on the “More Options” arrow and select HTTP UserDef1 to open the main page of Grafana.
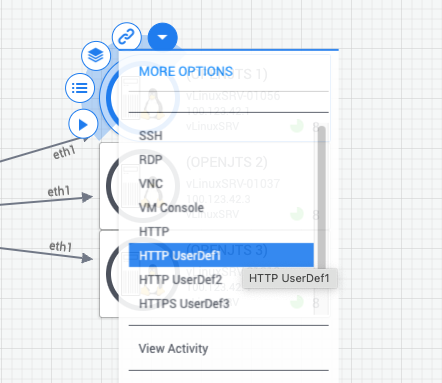
You can select one of the available Dashboards associated with the profiles you assigned to your router. For the “Health” profile, prefer to use the dedicated “VMX ROUTER Health” profile.
Note: VMX does not support all the Telemetry paths - some data may be missing.
Stop OpenJTS and clean your VM
Before leaving the Hands-on lab, take care to stop the OpenJTS stack - From your OpenJTS VM:
sudo su
>> fill in the password: Juniper!1

cd /opt/JTS/compose

docker compose down
And finally clean all the containers for the next student:
docker system prune -a -f
You can now close all terminals. Thank you