
Paragon Automation - Active Assurance
Overview
Paragon Automation Active Assurance use-case is a programmable, active test and monitoring solution for physical, hybrid, and virtual networks.
Active Assurance use-case brings the following capabilities into the system
It uses active, synthetic traffic to verify application and service performance at the time of service delivery and throughout the service lifecycle. To implement the validation, Active Assurance offers time limited validation checks (Tests), or 24/7/365 continous validation checks (Monitors).
It enables service delivery teams to verify that services are configured correctly the first time and validate that changes don’t impact service quality.
It helps network operations teams identify, troubleshoot, and resolve issues before users notice them, reducing incident resolution time by up to 50%.
It provides end-to-end service insights for service activation testing, quality monitoring, and troubleshooting from Layer 2 to Layer 7.
It uses software-based test agents that can be deployed as in docker containers or on network devices to generate active test traffic across the network.
It has an open API that enables integration with orchestrators, OSS, and automation tools for remote control and monitoring of the test agents.
The supported Juniper devices are the following ones:
MX240, MX304, MX204, MX480, MX960, MX10004, MX10008
ACX7100-32C, ACX7100-48L, ACX7024, ACX7024X, ACX7332, ACX7348, ACX7509
PTX10001-36MR, PTX10008
This lab will help you to understand the different components in the Active Assurance use-case and to use it.
Concepts
Paragon Automation contains several concepts that are going to be used during the Lab. This section explains the main ones
Measurement
A measurement refers to the quantitative performance metrics like latency, throughput, loss, etc. obtained by the test agents when generating synthetic traffic flows to actively measure and monitor service quality across the network infrastructure.
Plugin
Plugins are modular software components used by the Active Assuranceto execute specific types of active tests or monitors across physical and virtual networks. They are named with the type of activity they perform (DNS, HTTP, RPM HTTP). There are 2 type of plugins
Test Agent plugins: The ones that can be used by a Docker Test Agent (such as HTTP, DNS, Ping)
RPM plugins: The ones that can be directly used by supported devices and does not require a Test Agent in site (RPM Ping, RPM TWAMP,etc)
Test Agents
Test agents are the core software components responsible for generating active test traffic and measurements in active assurance solution used for service testing, monitoring and troubleshooting across physical and virtual networks.
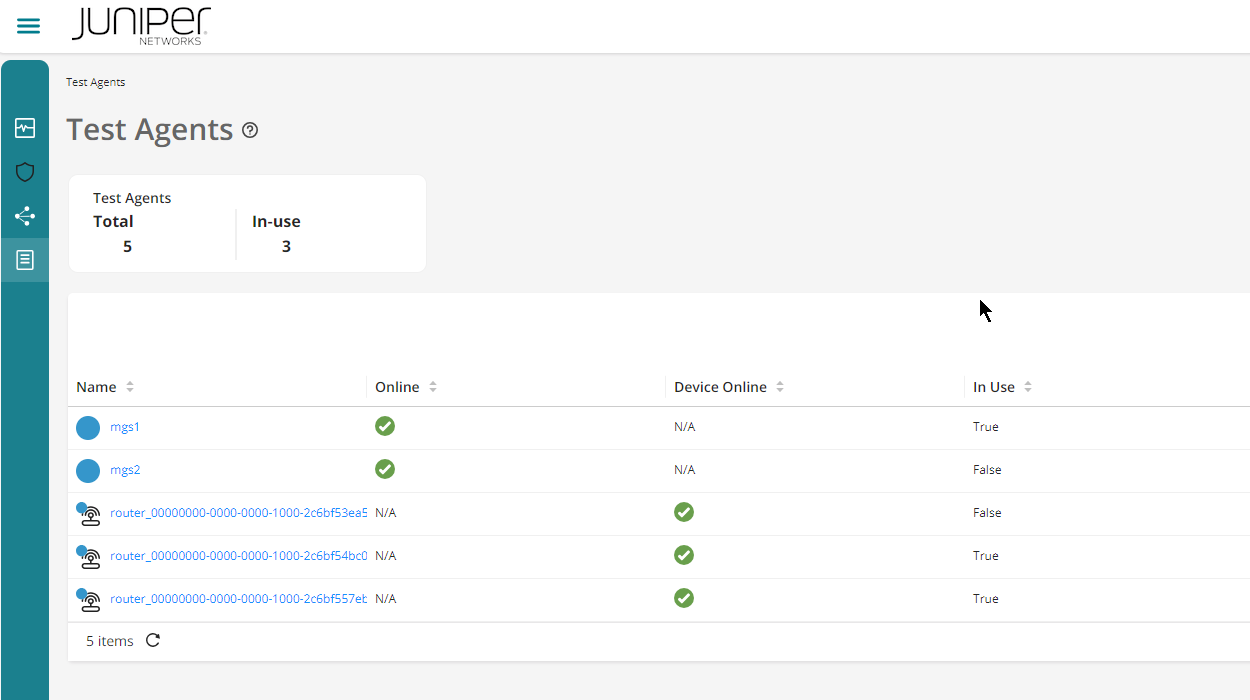
Here we will see both Test Agents and router devoces that support Active Assurance capabilities
MX devices supports Active Assurance capabilities via RPM plugins. When the RPM functionality is supported in the device, the UI will show Device Online
ACX devices supports Active Assurance capabilities via RPM plugins and native Test Agent plugins. ACX has the capability to host a native Test Agent (docker container). When the RPM functionality is supported in the device, the UI will show Device Online. When the native Test Agent plugin is supported in the ACX device, both Online and Device online checks will be present in the UI
Test Agent (docker container): Test Agents are displayed with a different icon in the list to highlight that are stand-alone agents and not a router Device. For that reason, RPM plugins are not available since it is not a Device
Test
Tests in Active Assurance is a time limited compilation of netowork’s checks (such as UDP, TCP, OTT) that is configured in Paragon Automation. It can run one or more tasks in parallel or in sequence. A task is job that needs to be executed in the Test Agent and is mapped with a specific selected plugin (such as UDP, TCP, OTT). It will injecting synthetic traffic into the live network and measuring performance metrics to proactively verify service quality, troubleshoot issues, and validate network changes and policies using programmable test agents.
A Test has a binary successufl result (PASSED or FAILED), which summarizes the status of the checks perviously configured.
If errors are encountered, the test will reflect an ERROR result. This indicates that a major error has happened during the configuraiton or execution of the test and the system cannot verify the result.
Monitors
It defines the configuration elements that will be applied to device interfaces during the onboarding process. It specifies settings like:
IP addressing (IPv4/IPv6) and whether addresses should be automatically assigned from resource pools
Whether the interface will be used for management or internet connectivity
Routing protocol configurations like OSPF, IS-IS, LDP, RSVP to be enabled on the interface
Measurement Designer
The Measurement Designer allows network teams to programmatically build customized active test cases or monitors aligned to their service requirements, enabling them to proactively validate performance, identify issues and assure service delivery before users are impacted
It is a web-based canvas view for tests and monitors
A test can contain multiple sequential steps and parallel tasks per step executed for a limited time period (also configurable per step)
A monitor is built in a unique step with multple parallel tasks. This is not time limited network check. Instead, It enables survillance of your resources 24/7/365.
Starting Lab
The lab is going to be compose of the following equipments:
Paragon Automation cluster
At least 1 ACX device
At least 1 docker container test agent running in an Ubuntu 22.04LTS vanilla VM.
Lab Blueprint Topology
The blueprint consists of four sets of vMX devices with traffic agents (TA’s), SET A, B, C and D. Also, a standalone shared ACX7100. Please note that you must choose the right SET of devices allocated to you.
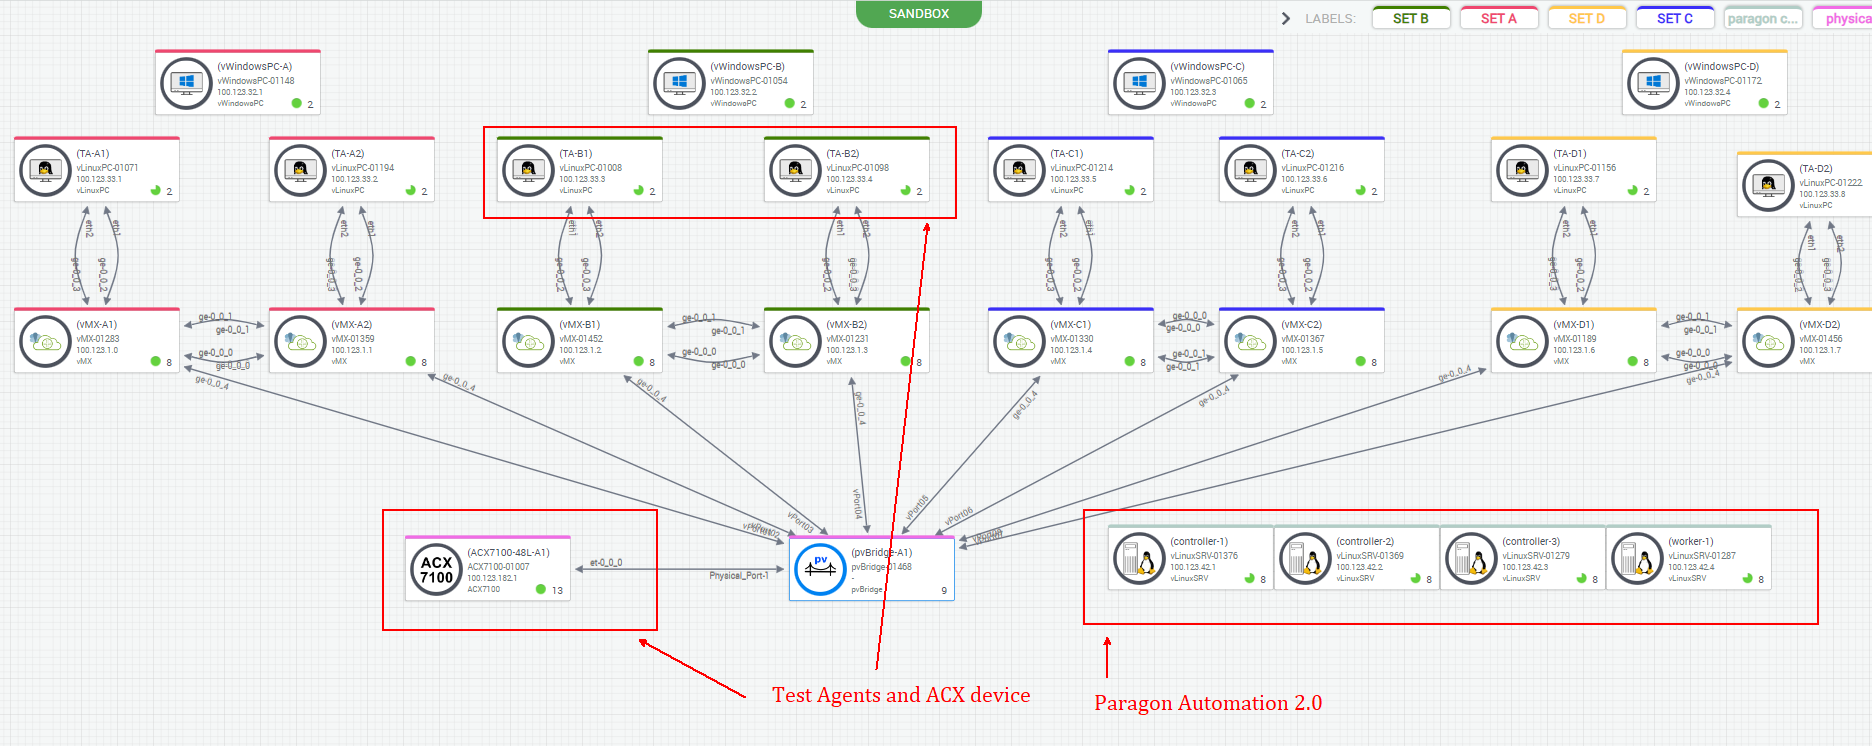
ACX is the main device that will be used for Active Assurance demo
ACX: can use the following plugins
RPM plugins natively in the ACX
Test Agent plugins via a Test Agnet installed in the router
vMX can be used as a target device for reachability during the demo
Internet resource will be needed to verify Internet resource reachablitiy
Paragon Automation Cluster: This is the main system to orchestrate and manage all the devices. This is the main system to inteceract with. Here it is possible to set the following elements
Router adoption
Interface profile configuration
Device profile configuration
Network implementation plan
Visualization of the devices
Login to Paragon
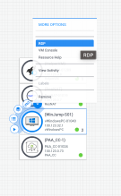
Go to your Lab User Set, and hover over the vWindowsPC-*, and select RDP
Login using your Lab User credentials
Open Chrome, and navigate to https://100.123.42.100, you shoud see the login page to Paragon Automation UI
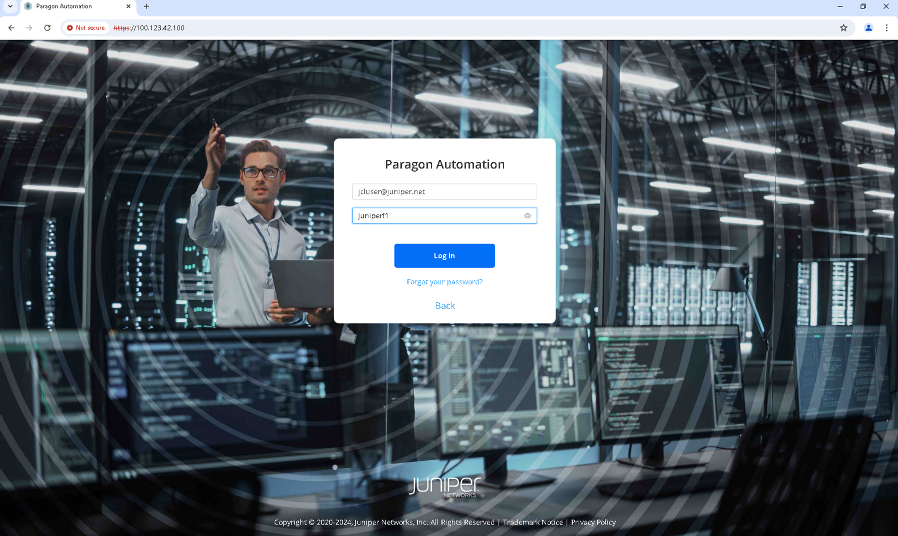
Login using your Lab User credentials
Test Agent inventory
Go to the Inventory > Active Assurance > Test Agents
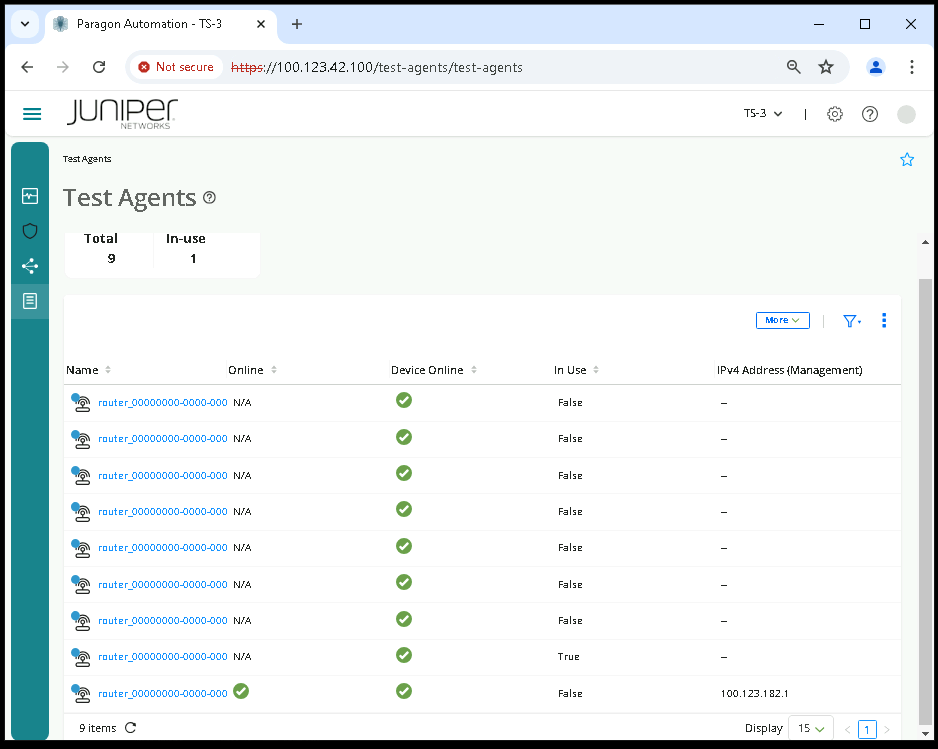
Click on a stand alone Test Agent
Insepct and expand the accordions to see the contained information
Find the number of interfaces that the test agent has
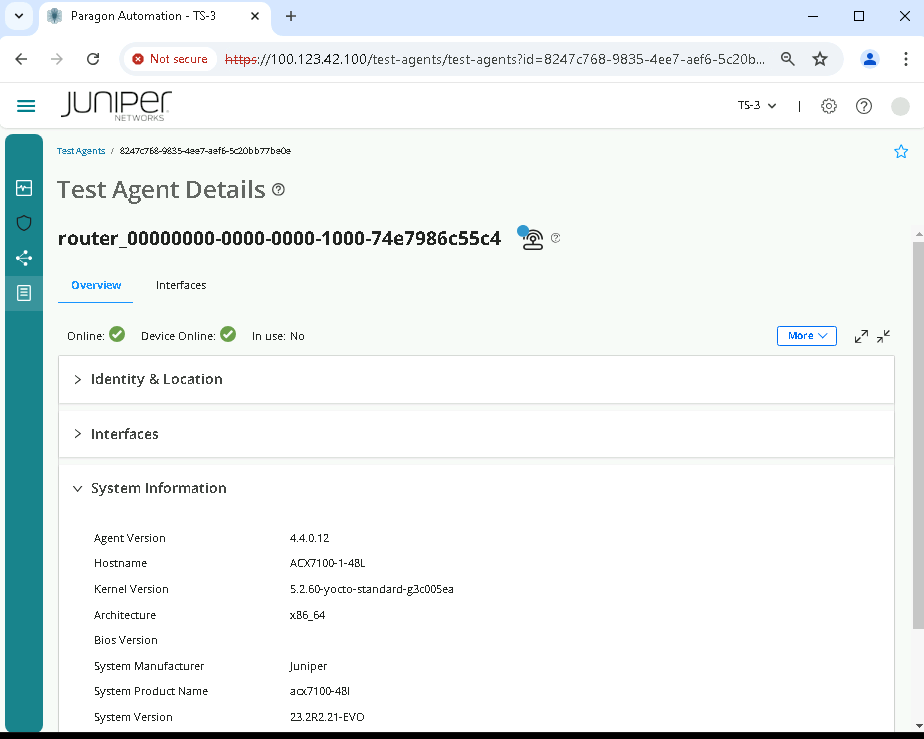
Click on the ACX router
Insepct and expand the accordions to see the contained information
Find the number of interfaces that the test agent has
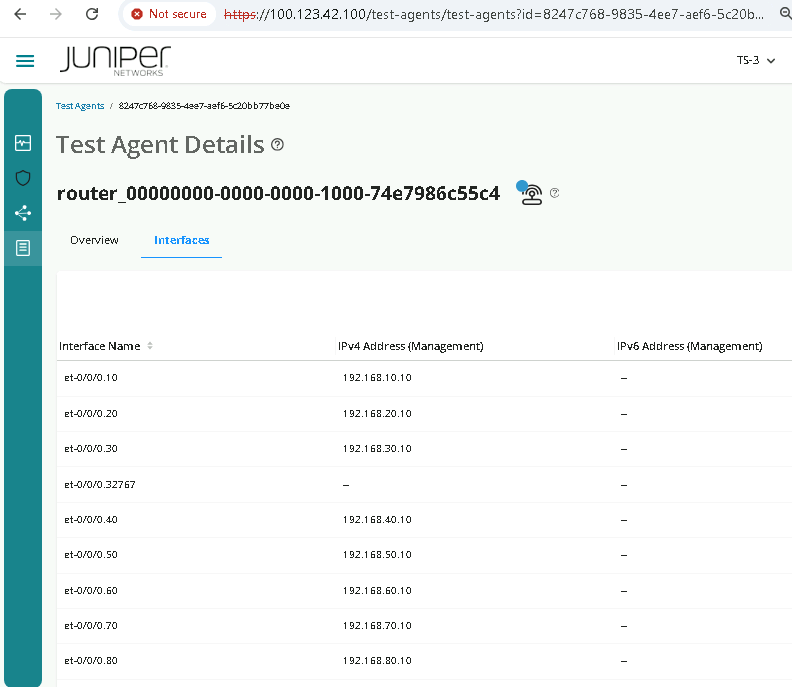
Go to the interface tab and inspect the interfaces
We can see here that the interfaces matches the router interfaces. Test Agent interfaces shown in this section are the ones the Test Agent see from the underneath platform
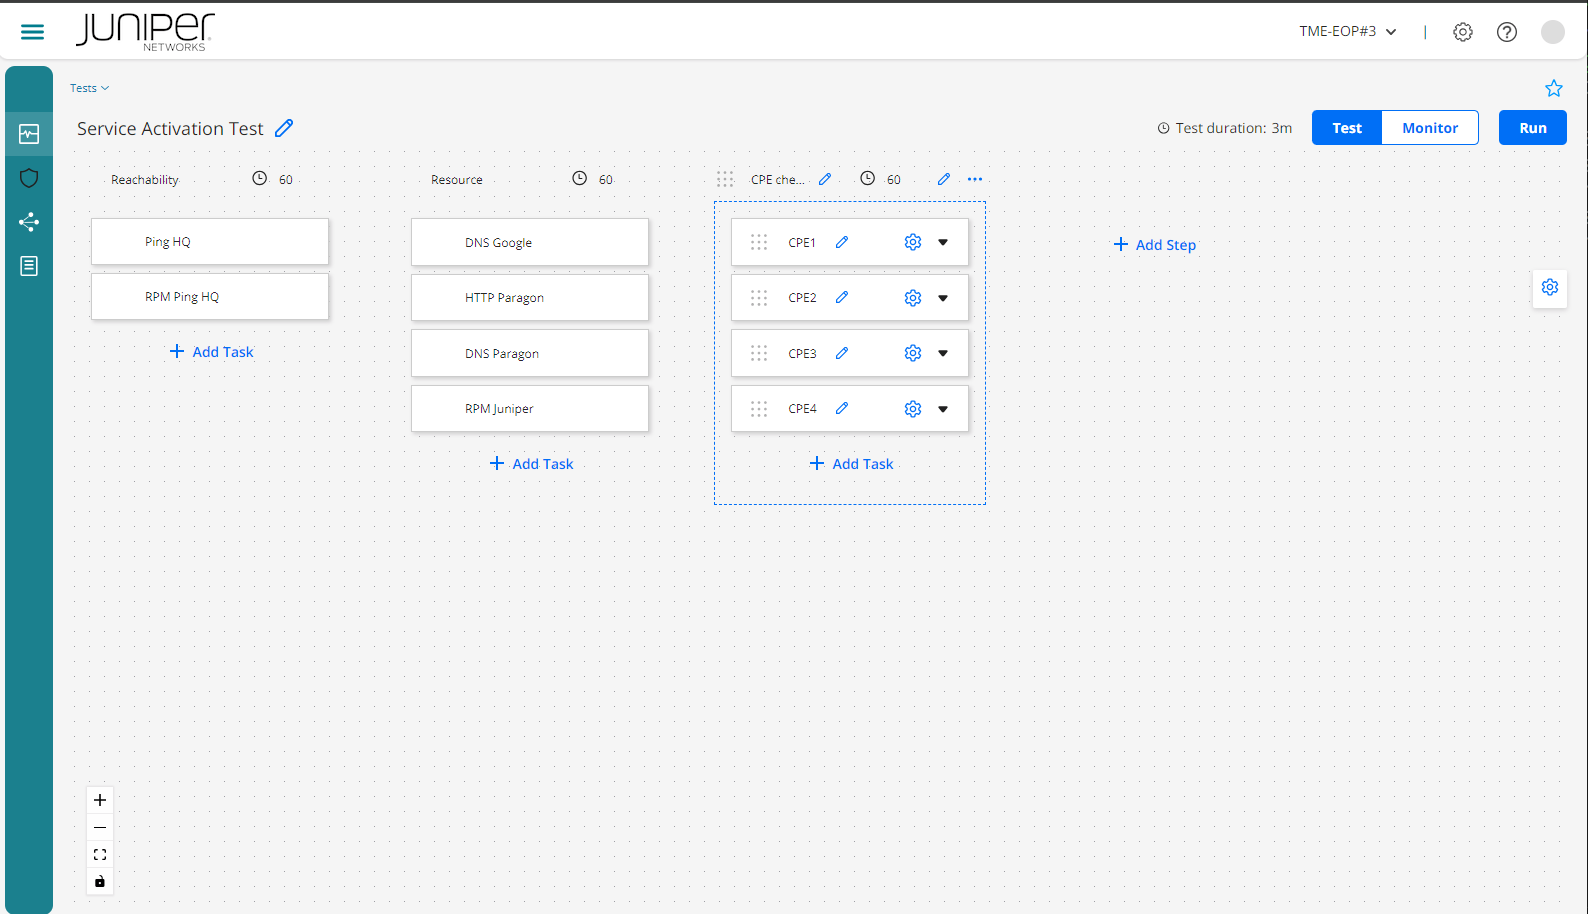
Measurement Designer - Test Creation
This section will walk you through the test creation via the Measurement Designer. In this area we can create tests with one or more steps. As it was mentioned before, test’s steps run in sequence. Each step would have one or more parallel tasks
In the task inventory list displayed after clicking Add Task, it is possible to differinciate 2 main task types
Tasks starting with the word RPM indicates that can be run in devices directly. These are ACX MX and PTX without the need of having a docker Test Agent onboarded.
Tasks without the word RPM in its name are reserved to stand-alone test agents. The stand-alone test agent can run in multiple platforms (such as Ubuntu server or ACX). Having a Test Agent in the ACX enables the possibility of running an expanded list of plugins
This section offers an example of how to create a test by choosing and configuring plugins in the Measurement Designer. The example uses Test Agent applications but you can choose the ACX platform with RPM plugins or stand-alone plugins
Test Creation
Go to the Inventory > Observability > Active Assurance > Measurement Designer
Choose Create blank test
Add a name to the test
Set the time to 60seconds in the step 1
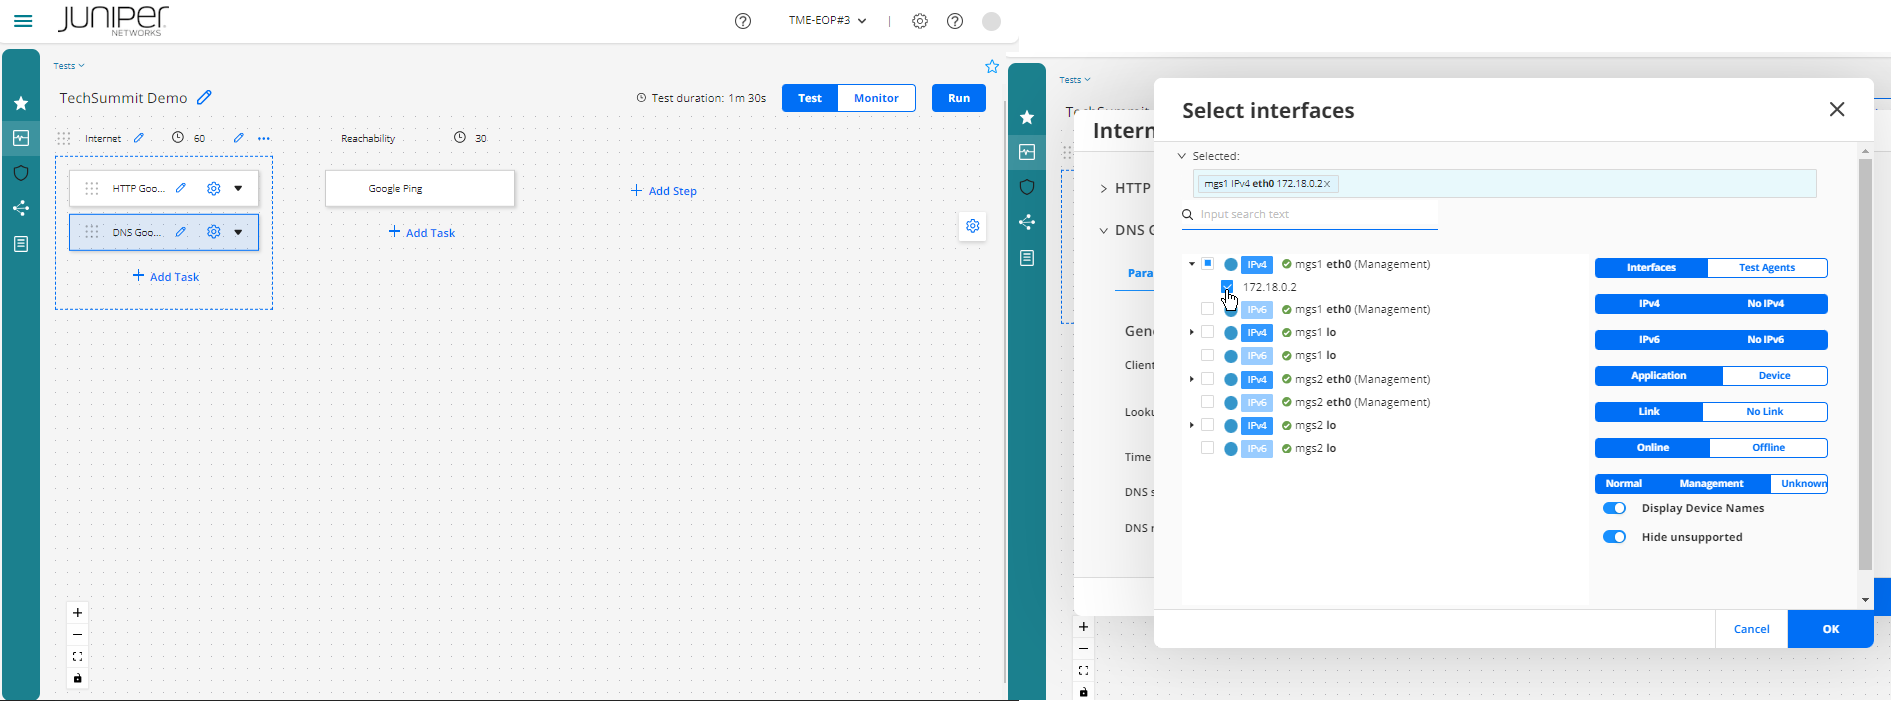
Click on Add Task
Select a HTTP task
Configure the task with an Ineternet destination
Select stand alone Test Agent For example www.google.com
Click Ok
Click add a parallel task (Choose DNS)
Select the ACX Test Agent device (the one that says Online and Device Online green checks) or a stand alone Test Agent
For example www.google.com
Select a DNS server. 8.8.8.8
Add a new step
Select the Ping plugin
Select the ACX Test Agent device (the one that says Online and Device Online green checks) or a stand alone Test Agent
Destination: Enter an Internet IP of the ACX or vMX and give it a name
Click Ok
Increase the time of this step to run for 60 seconds
Click Run
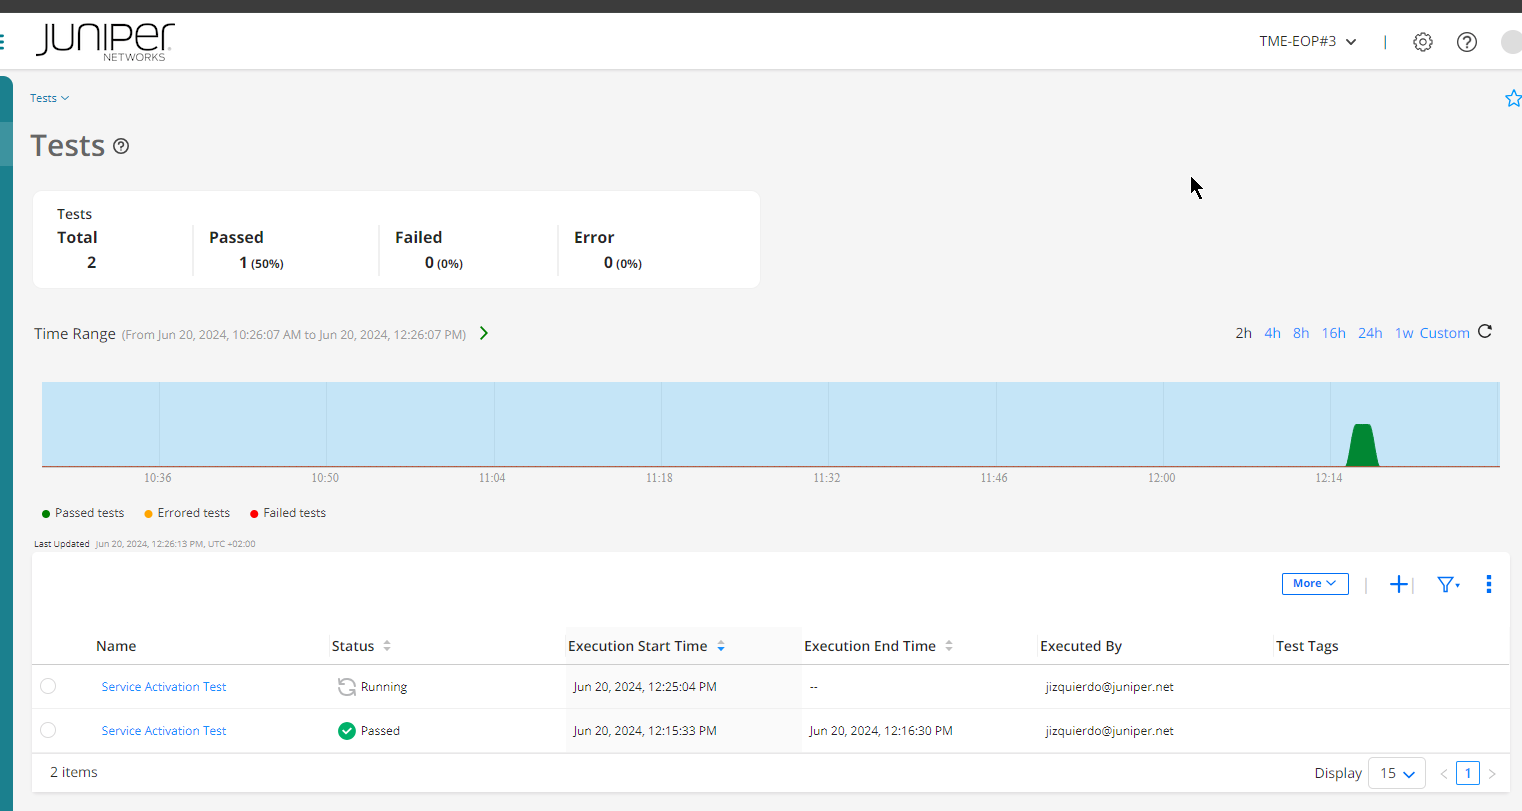
Test Results
The system will show the detail page for the test where the results can be consumed. This section can be also accessed from the Test List in Observability > Active Assurance > Tests
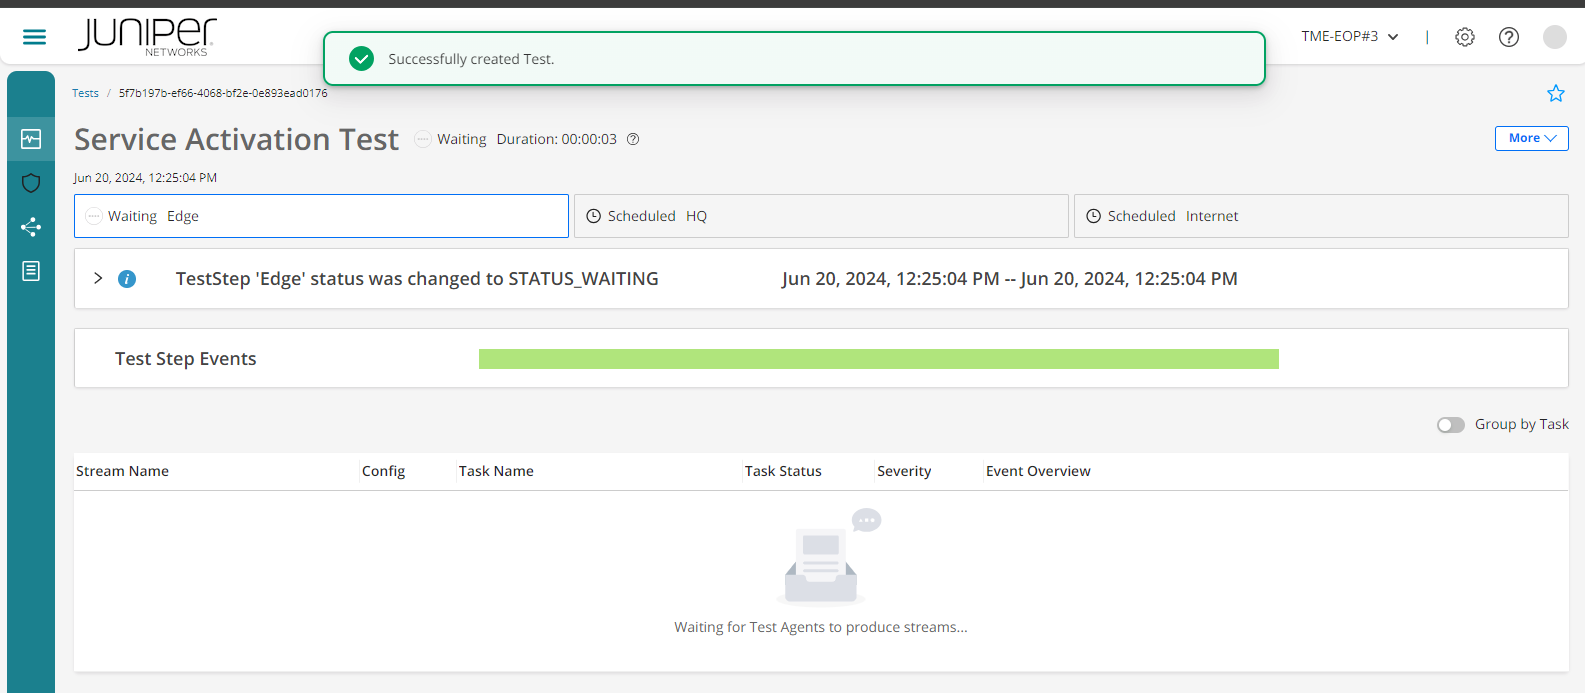
Once the test has finished, it will give the different results
Passed, this indicates if the test has passed
It is also diplayed per measurement
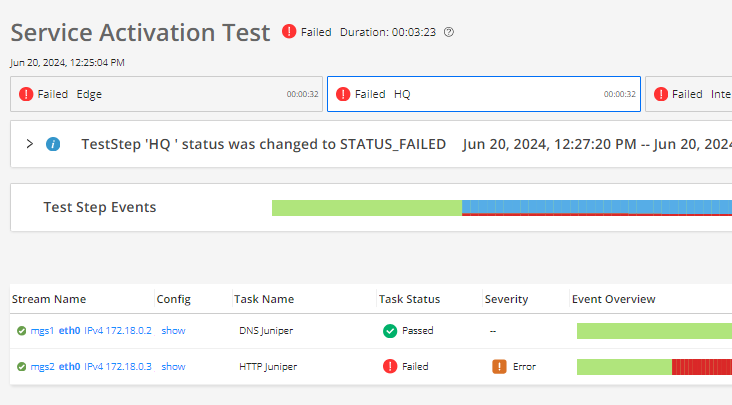
Failed, this indicates if the test has failed
It is also diplayed per measurement
Error, this indicates if the test has any error during the configuration or execution. You can see more event information in the event section to identify the issue
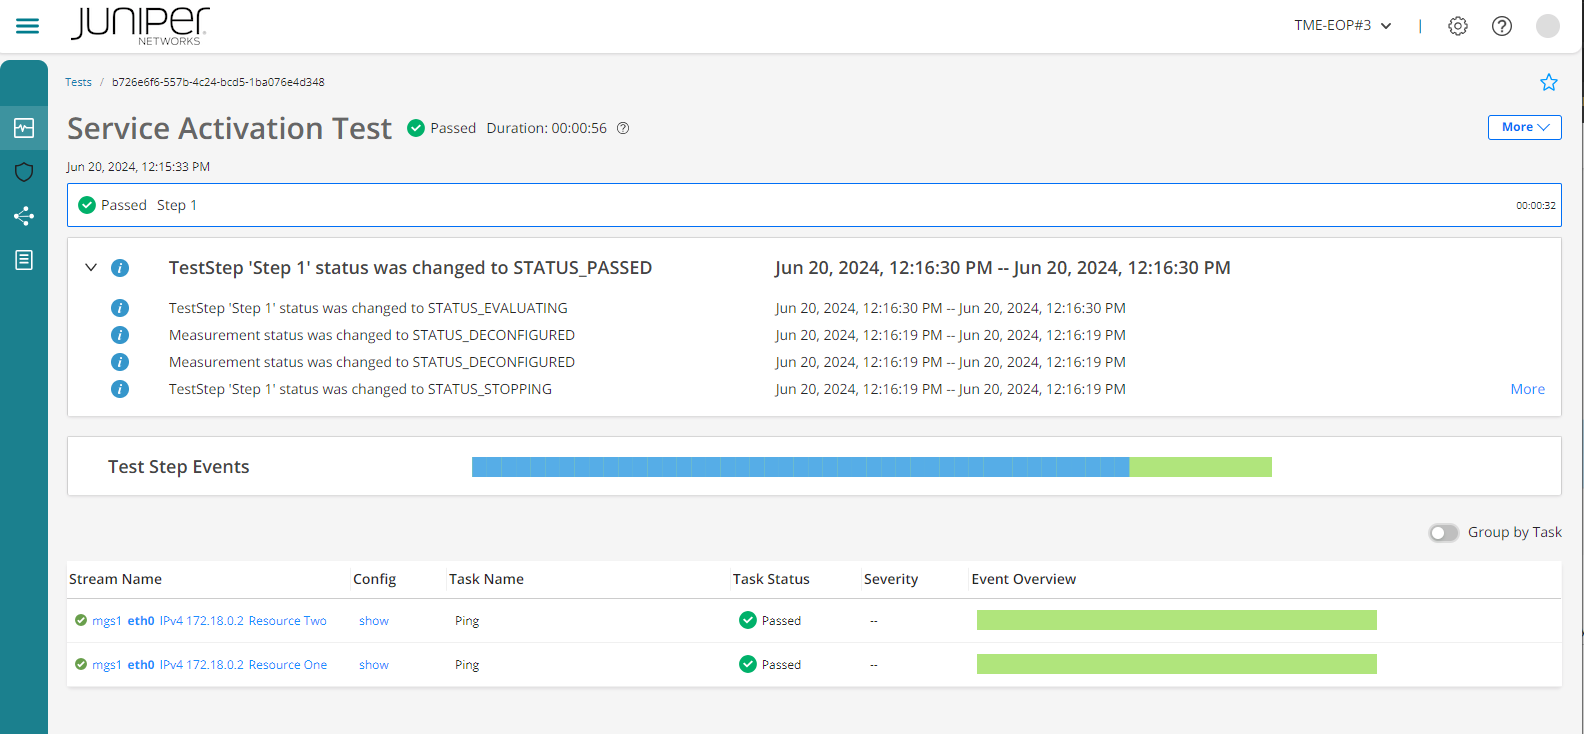
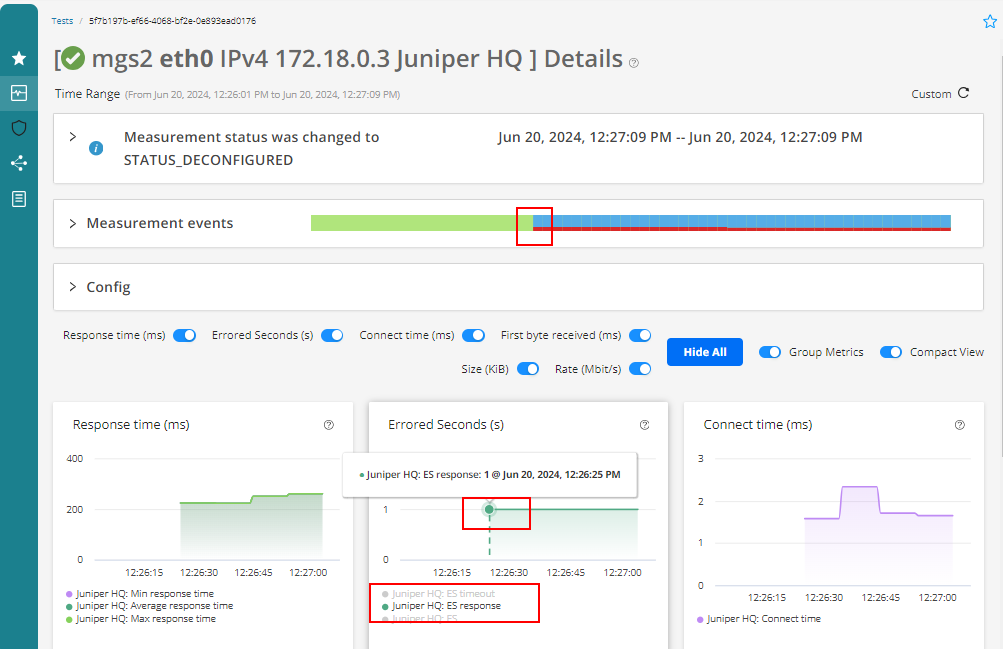
Inspect the test and the Streams created. They contain detailed data information that helps you to understand the KPIs related to that test
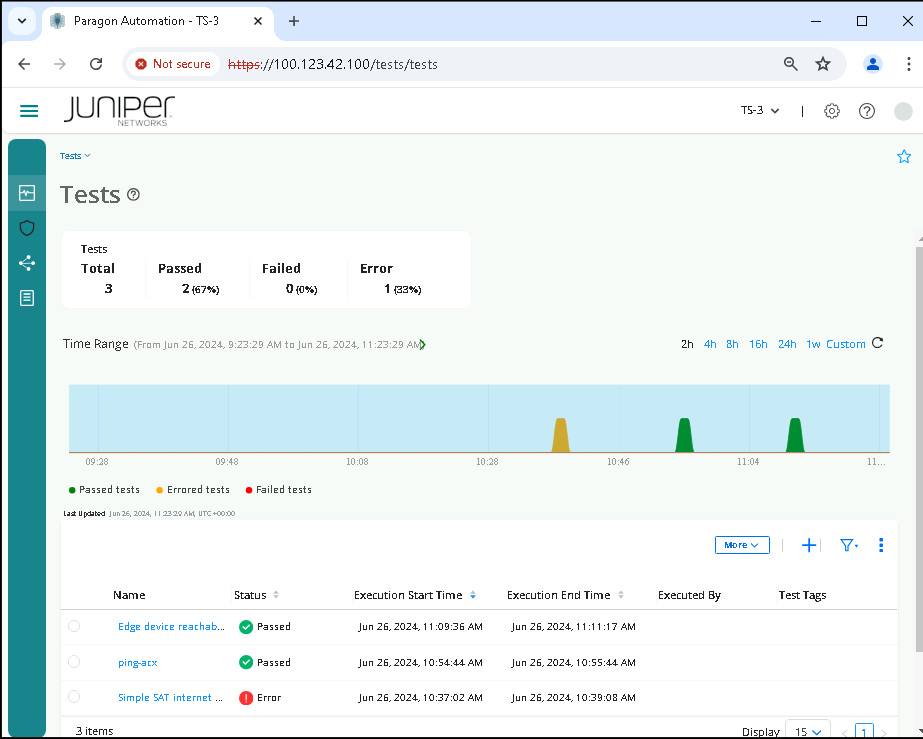
Test list
Go to the Inventory > Observability > Active Assurance > Tests
Inspect the list of tests displayed there
Navigate to the test time line in the upper right corner to select a different time window. This action will show the number of tests filtered by time
Identify which tests have passed or failed and which have errors
Click on one test (preferable with a fail status) to inspect the test results
Group by task to
Monitor List
The monitor section shows the concurent monitors running in the underneath network. A test agent can be part of one or several monitors
Go to Inventory > Observability > Active Assurance > Monitors
Identify the list of running monitors vs the stopped ones
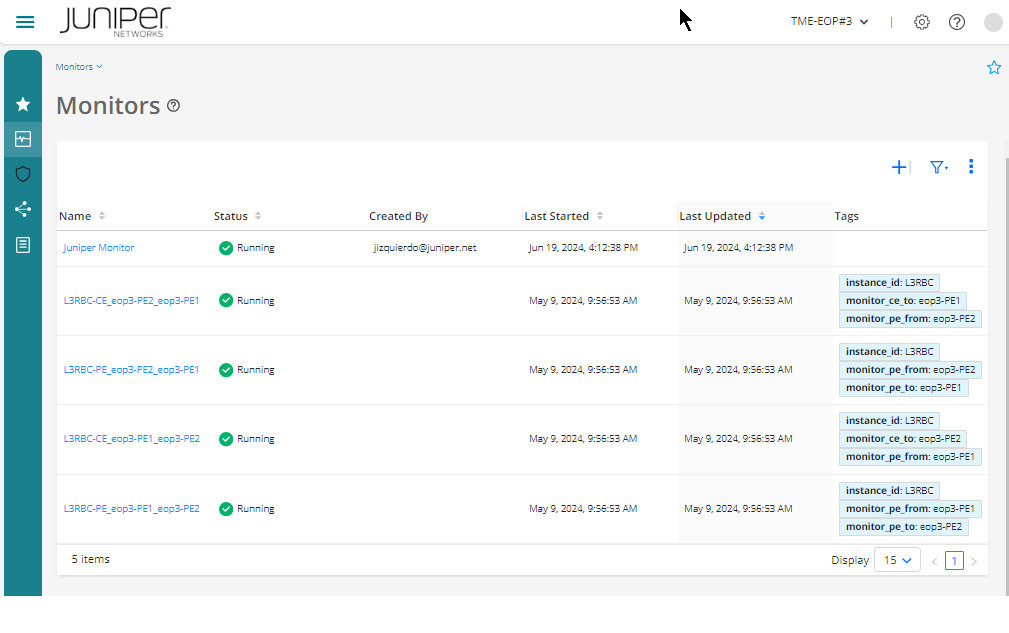
Select one of the monitors
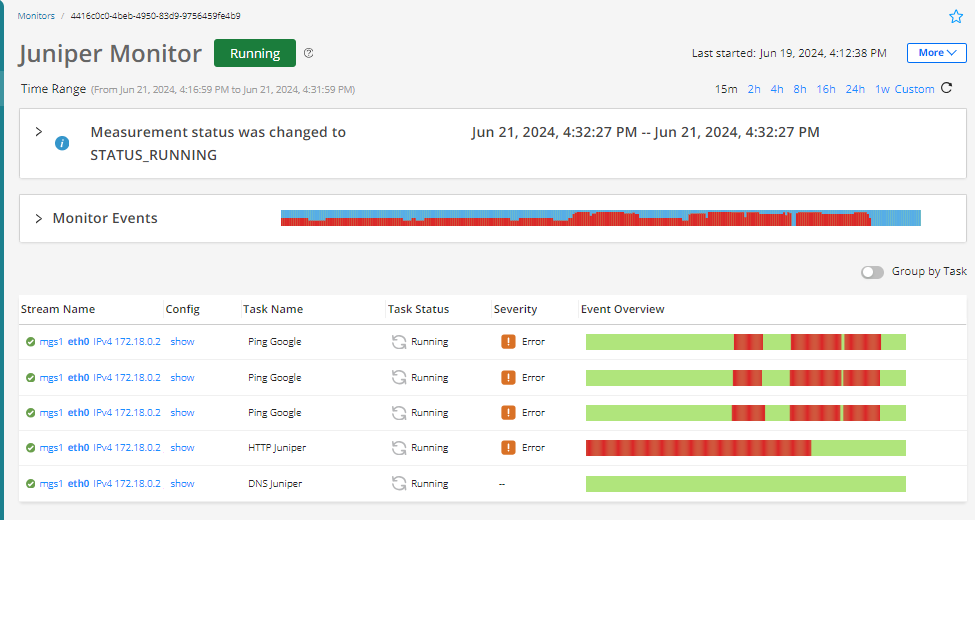
Identify the streams that presents problems (if any) versus the ones that does not present any issue
For example, in the following picture, we can identify that the first 4 streams present issues while the last one doesn’t
Identify the Task Name of each stream. The Task Name has a default value when configured in the Measurement Designer. However, that name can be adapted to a particular use-case.
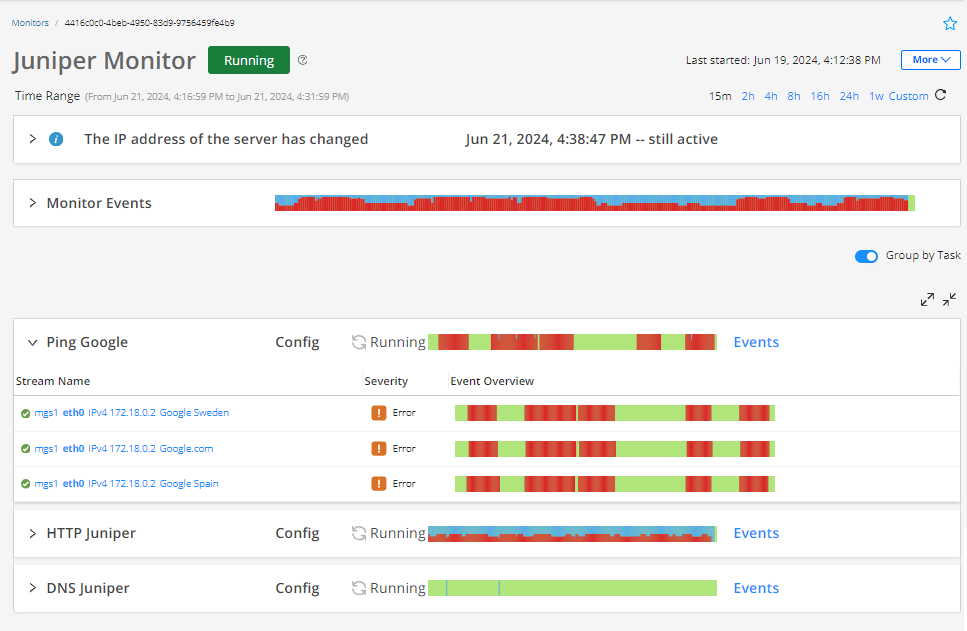
Group by task option: This function changes the visualization of the streams. It matches the Measurement Designer layout when the monitor was creted
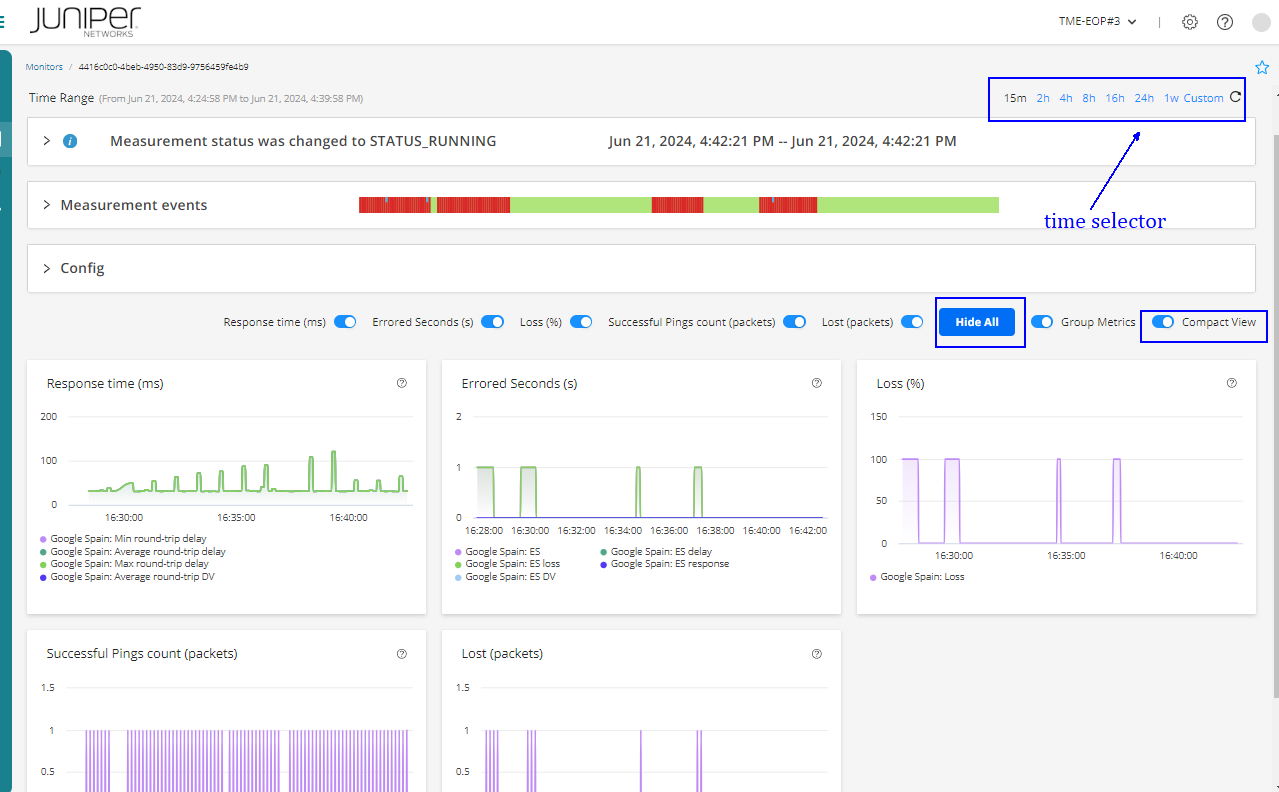
Inspect a stream that presents issues
This view is similar to the one seen in tests
Here you can select a time period to visualize the results. Rememeber that monitors run 24/7/365. There might be periods (when the monitor is stopped) that there is no data available
Expand all the KPIS and enable the Compact View
Conclusions
Paragon Automation Active Assurance enables network visualization capabilities by using synthetic traffic that traverse the network. To do that, it uses test agents and deployed routers deployed in the network. Paragon Automation analyzes the data collected and transforms it highlighting the errors encounterd. It uses time limited tests or 24/7/365 monitors to identify network issues